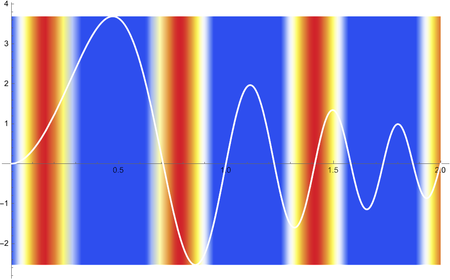
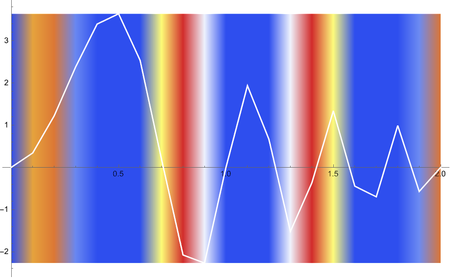
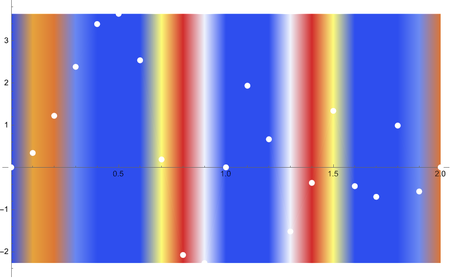
I would like to plot a two dimensional list (ListPLot [{x, y[x]}]) where the background color is changing with x value according to the value assumend by an external function f[x]. Thank you. Sorry, I have to be more precise. This is what I mean fo the function Plot
f[x_] := 6 E^-x Sin[2*Pi*x^2];
g[x_] := Sin[2*x*10];
Plot[{f[x], ConditionalExpression[0, g[x] < 0]}, {x, 0, 2},
PlotStyle -> {Black, None},
Filling -> {2 -> {Bottom, Red}, 2 -> {Top, Red}}]
I would like to be the same working with list and ListLinePLot.


yandf? $\endgroup$ContourPlot), or do you want to change the color of the individual points according to your functionf[x]? $\endgroup$DensityPlotin the background with aListLinePlotin the foreground. $\endgroup$