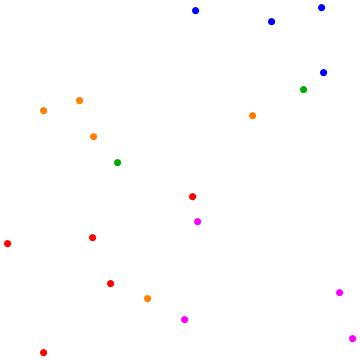
Here is a sample set of data
m = {{3.37778, -2.73333, 21, 2}, {0.644444, 2.28889, 9, 3},
     {2.82222, -4.6, 13, 4}, {4.15556, -2.4, 17, 1},
     {-0.866667, -0.4, 6, 2}, {3.64444, 2.26667, 26, 4},
     {2.08889, 3.73333, 12, 3}, {1.73333, -4.48889, 12, 4},
     {-4.44444, -0.777778, 14, 2}, {-4.62222, 2.2, 12, 5},
     {0.977778, 0.755556, 18, 5}, {1.77778, -0.822222, 10, 1},
     {-1.02222, -1.86667, 11, 2}, {4.62222, 4.82222, 16, 3},
     {2., 2., 13, 3}, {0.666667, -1.88889, 8, 4},
     {-2.15556, 4.64444, 18, 5}, {-3.08889, 3.37778, 12, 5},
     {0.311111, -4.22222, 12, 4}, {-4.26667, -3.31111, 12, 2}};
The first two elements of the list represent the coordinates $(x,y)$, while the other two integers $k$, $n$, indicate other type of information.
Now let's setup a color code according to the second integer $n$ (last column)
getColor[m_List, i_Integer] := Module[{s = m[[i, 4]]},
Which[s == 0, Black, s == 1, Darker[Green], s == 2, Red, s == 3,
Blue, s == 4, Magenta, s == 5, Orange, s == 6, Cyan, s == 7,
Brown]];
and then create the graph
data = Table[{PointSize[0.02], getColor[m, i], Point[{m[[i, 1]],
       m[[i, 2]]}]}, {i, 1, Length[m]}];
S0 = Graphics[data];
Now I would like the to keep the colors according to $n$ but modify their tone according to the value of the first integer $k$ (third column). In particular, plot again the $(x,y)$ points in tones of green, red, blue, magenta, etc where darker color means higher value of $k$.
EDIT
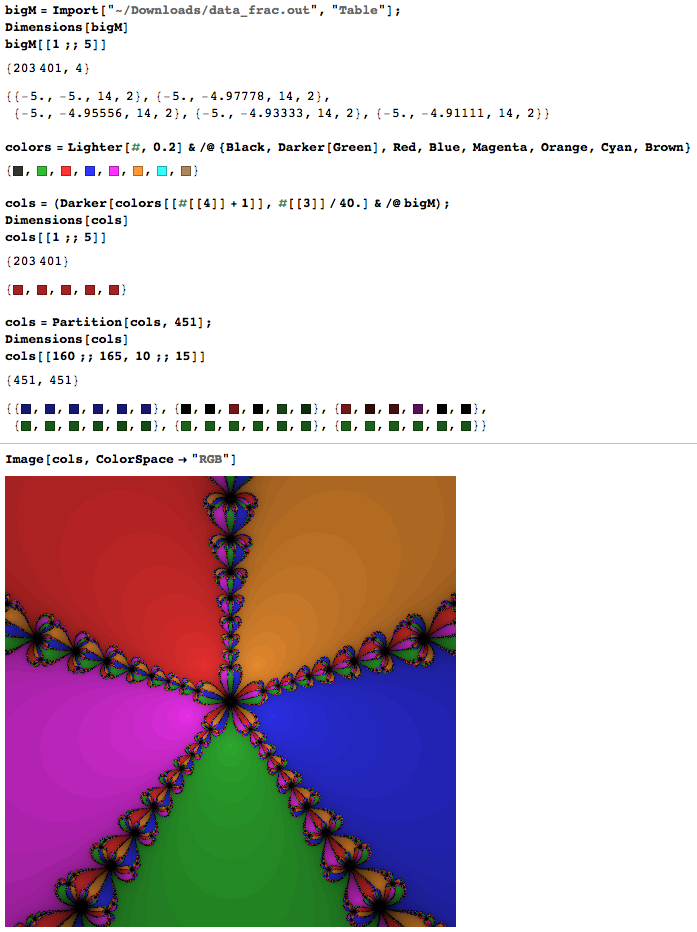
Applying @J.M method to the actual data file the output is the follwoing
clist = {Black, Darker[Green], Red, Blue, Magenta, Orange,
 Cyan, Brown};
 Graphics[{PointSize[0.02], MapThread[{Darker[clist[[#[[4]] + 1]], #2],
 Point[Take[#, 2]]} &, {m, 1 - Rescale[m[[All, 3]]]}]}]
As we can see the entire plot is too dark and the colors are hardly distinguishable.
In case anyone wants to play with the actual data file
The resulted plot should be something like this
Any suggestions?
Many thanks in advance!


Lighterwith akproperly rescaled. $\endgroup$