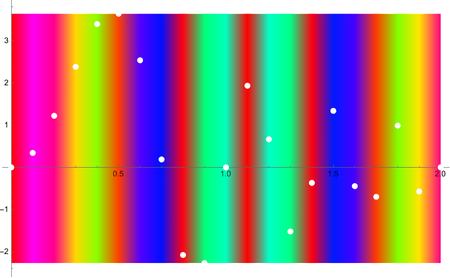
deleted 33 characters in body
Source Link
cvgmt
  • 84.1k
  • 6
  • 97
  • 179
  • Plot.
f[x_] := 6 E^-x Sin[2*Pi*x^2];
g[x_] := Sin[2*x*10];
Plot[{f[x], f[x]}, {x, 0, 2}, 
 ColorFunction -> Function[{x, y}, Hue[g@x]]ColorData["TemperatureMap"][g@x]], 
 ColorFunctionScaling -> True, Filling -> {{1 -> Bottom}, {2 -> Top}},
  Epilog -> 
  Plot[f[x], {x, 0, 2}, 
    PlotStyle -> {AbsoluteThickness[2], White}][[1]]]
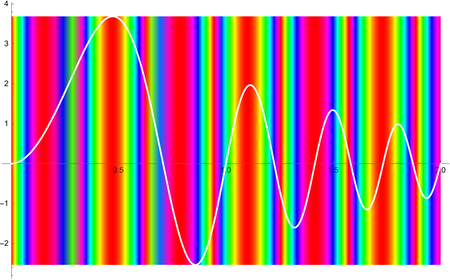
enter image description hereenter image description here

  • ListPlot+ Joined -> True
f[x_] := 6 E^-x Sin[2*Pi*x^2];
g[x_] := Sin[2*x*10];
data = Table[{x, f[x]}, {x, 0, 2, .1}];
ListPlot[{data, data}, Joined -> True, 
 ColorFunction -> Function[{x, y}, Hue[g@x]]ColorData["TemperatureMap"][g@x]], 
 ColorFunctionScaling -> True, Filling -> {{1 -> Bottom}, {2 -> Top}},
  Epilog -> ListPlot[data, PlotStyle -> White, Joined -> True][[1]]]

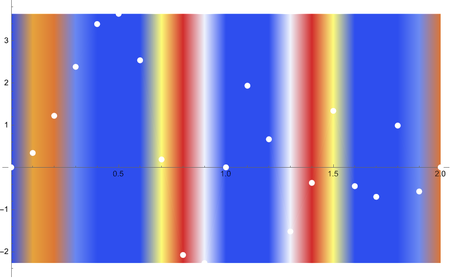
enter image description hereenter image description here

  • ListPlot+ Joined -> False

enter image description hereenter image description here

  • Plot.
f[x_] := 6 E^-x Sin[2*Pi*x^2];
g[x_] := Sin[2*x*10];
Plot[{f[x], f[x]}, {x, 0, 2}, 
 ColorFunction -> Function[{x, y}, Hue[g@x]], 
 ColorFunctionScaling -> True, Filling -> {{1 -> Bottom}, {2 -> Top}},
  Epilog -> 
  Plot[f[x], {x, 0, 2}, 
    PlotStyle -> {AbsoluteThickness[2], White}][[1]]]
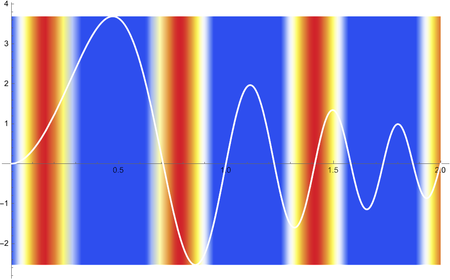
enter image description here

  • ListPlot+ Joined -> True
f[x_] := 6 E^-x Sin[2*Pi*x^2];
g[x_] := Sin[2*x*10];
data = Table[{x, f[x]}, {x, 0, 2, .1}];
ListPlot[{data, data}, Joined -> True, 
 ColorFunction -> Function[{x, y}, Hue[g@x]], 
 ColorFunctionScaling -> True, Filling -> {{1 -> Bottom}, {2 -> Top}},
  Epilog -> ListPlot[data, PlotStyle -> White, Joined -> True][[1]]]
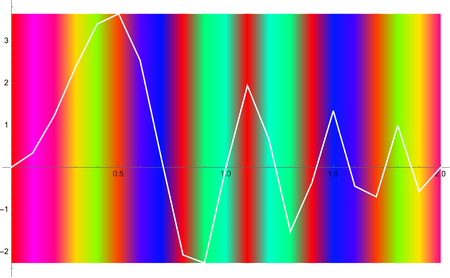
enter image description here

  • ListPlot+ Joined -> False

enter image description here

  • Plot.
f[x_] := 6 E^-x Sin[2*Pi*x^2];
g[x_] := Sin[2*x*10];
Plot[{f[x], f[x]}, {x, 0, 2}, 
 ColorFunction -> Function[{x, y}, ColorData["TemperatureMap"][g@x]], 
 ColorFunctionScaling -> True, Filling -> {{1 -> Bottom}, {2 -> Top}},
  Epilog -> 
  Plot[f[x], {x, 0, 2}, 
    PlotStyle -> {AbsoluteThickness[2], White}][[1]]]

enter image description here

  • ListPlot+ Joined -> True
f[x_] := 6 E^-x Sin[2*Pi*x^2];
g[x_] := Sin[2*x*10];
data = Table[{x, f[x]}, {x, 0, 2, .1}];
ListPlot[{data, data}, Joined -> True, 
 ColorFunction -> Function[{x, y}, ColorData["TemperatureMap"][g@x]], 
 ColorFunctionScaling -> True, Filling -> {{1 -> Bottom}, {2 -> Top}},
  Epilog -> ListPlot[data, PlotStyle -> White, Joined -> True][[1]]]
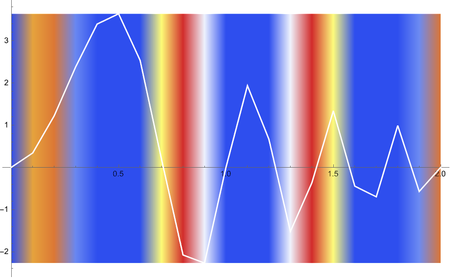
enter image description here

  • ListPlot+ Joined -> False

enter image description here

added 55 characters in body
Source Link
cvgmt
  • 84.1k
  • 6
  • 97
  • 179
  • Plot.
f[x_] := 6 E^-x Sin[2*Pi*x^2];
g[x_] := Sin[2*x*10];
Plot[{f[x], f[x]}, {x, 0, 2}, 
 ColorFunction -> Function[{x, y}, Hue[g@x]], 
 ColorFunctionScaling -> True, Filling -> {{1 -> Bottom}, {2 -> Top}},
  Epilog -> 
  Plot[f[x], {x, 0, 2}, 
    PlotStyle -> {AbsoluteThickness[2], White}][[1]]]

enter image description here

  • ListPlot+ Joined -> True
f[x_] := 6 E^-x Sin[2*Pi*x^2];
g[x_] := Sin[2*x*10];
data = Table[{x, f[x]}, {x, 0, 2, .1}];
ListPlot[{data, data}, Joined -> True, 
 ColorFunction -> Function[{x, y}, Hue[g@x]], 
 ColorFunctionScaling -> True, Filling -> {{1 -> Bottom}, {2 -> Top}},
  Epilog -> ListPlot[data, PlotStyle -> White, Joined -> True][[1]]]

enter image description here

  • ListPlot+ Joined -> False

enter image description here

  • Plot.
f[x_] := 6 E^-x Sin[2*Pi*x^2];
g[x_] := Sin[2*x*10];
Plot[{f[x], f[x]}, {x, 0, 2}, 
 ColorFunction -> Function[{x, y}, Hue[g@x]], 
 ColorFunctionScaling -> True, Filling -> {{1 -> Bottom}, {2 -> Top}},
  Epilog -> 
  Plot[f[x], {x, 0, 2}, 
    PlotStyle -> {AbsoluteThickness[2], White}][[1]]]

enter image description here

  • ListPlot+ Joined -> True
f[x_] := 6 E^-x Sin[2*Pi*x^2];
g[x_] := Sin[2*x*10];
data = Table[{x, f[x]}, {x, 0, 2, .1}];
ListPlot[{data, data}, Joined -> True, 
 ColorFunction -> Function[{x, y}, Hue[g@x]], 
 ColorFunctionScaling -> True, Filling -> {{1 -> Bottom}, {2 -> Top}},
  Epilog -> ListPlot[data, PlotStyle -> White, Joined -> True][[1]]]

enter image description here

  • ListPlot+ Joined -> False

enter image description here

added 215 characters in body
Source Link
cvgmt
  • 84.1k
  • 6
  • 97
  • 179

Maybe similar with this.

  • Plot.
Plot[{f[x], f[x]}, {x, 0, 2}, 
 ColorFunction -> Function[{x, y}, Hue[g@x]], 
 ColorFunctionScaling -> True, Filling -> {{1 -> Bottom}, {2 -> Top}},
  Epilog -> 
  Plot[f[x], {x, 0, 2}, 
    PlotStyle -> {AbsoluteThickness[2], White}][[1]]]

enter image description here

  • ListPlot+ Joined -> True
f[x_] := 6 E^-x Sin[2*Pi*x^2];
g[x_] := Sin[2*x*10];
data = Table[{x, f[x]}, {x, 0, 2, .1}];
ListPlot[{data, data}, Joined -> True, 
 ColorFunction -> Function[{x, y}, Hue[g@x]], 
 ColorFunctionScaling -> True, Filling -> {{1 -> Bottom}, {2 -> Top}},
  Epilog -> ListPlot[data, PlotStyle -> White, Joined -> True][[1]]]

enter image description here

  • ListPlot+ Joined -> False

enter image description here

Maybe similar with this.

Plot[{f[x], f[x]}, {x, 0, 2}, 
 ColorFunction -> Function[{x, y}, Hue[g@x]], 
 ColorFunctionScaling -> True, Filling -> {{1 -> Bottom}, {2 -> Top}},
  Epilog -> 
  Plot[f[x], {x, 0, 2}, 
    PlotStyle -> {AbsoluteThickness[2], White}][[1]]]

enter image description here

  • Plot.
Plot[{f[x], f[x]}, {x, 0, 2}, 
 ColorFunction -> Function[{x, y}, Hue[g@x]], 
 ColorFunctionScaling -> True, Filling -> {{1 -> Bottom}, {2 -> Top}},
  Epilog -> 
  Plot[f[x], {x, 0, 2}, 
    PlotStyle -> {AbsoluteThickness[2], White}][[1]]]

enter image description here

  • ListPlot+ Joined -> True
f[x_] := 6 E^-x Sin[2*Pi*x^2];
g[x_] := Sin[2*x*10];
data = Table[{x, f[x]}, {x, 0, 2, .1}];
ListPlot[{data, data}, Joined -> True, 
 ColorFunction -> Function[{x, y}, Hue[g@x]], 
 ColorFunctionScaling -> True, Filling -> {{1 -> Bottom}, {2 -> Top}},
  Epilog -> ListPlot[data, PlotStyle -> White, Joined -> True][[1]]]

enter image description here

  • ListPlot+ Joined -> False

enter image description here

Source Link
cvgmt
  • 84.1k
  • 6
  • 97
  • 179
Loading