When I plot multiple curves with ContourPlot I get different colors between the curves and the legend. This is an issue that emerged from the Edit part of the Answer to this post. The code is this:
Clear["Global`*"]
n = 1;
eqns[i_, b_] = {D[w - 1/((1 - e) w), e] == D[1 - e, e] ((-((-a (i + ((1 - e) n (w/(b e^b))^(1/(b - 1)))/(1 - n e (w/(b e^b))^(1/(b - 1)))) + (-1 + a^2) (-1 + e)^2 w - a (-1 + e) (i + ((1 - e) n (w/(b e^b))^(1/(b - 1)))/(1 - n e (w/(b e^b))^(1/(b - 1)))) w^2)/(a (-1 + e) i (1 - e + i + ((1 - e) n (w/(b e^b))^(1/(b - 1)))/(1 - n e (w/(b e^b))^(1/(b - 1)))) w))) - (-((-a ((1 - e) n (w/(b e^b))^(1/(b - 1)))/(1 - n e (w/(b e^b))^(1/(b - 1))) + (-1 + a^2) (-1 + e) (-1 + e - i) w - a (-1 + e) ((1 - e) n (w/(b e^b))^(1/(b - 1)))/(1 - n e (w/(b e^b))^(1/(b - 1))) w^2)/(a (-1 + e) i (1 - e + i + ((1 - e) n (w/(b e^b))^(1/(b - 1)))/(1 - n e (w/(b e^b))^(1/(b - 1)))) w)))), D[e, w] == e/w, r == w/(a e), 0 <= i <= 1, 0 <= a <= 1, 0 <= e <= 1, w >= 0, 0 <= b <= 1};

colors = ColorData[97] /@ Range[3];

ContourPlot[
 Evaluate@Table[Simplify@eqns[1/10, 7/10], {a, {2/10, 8/10}}], {w, 0, 5}, {e, 0, 1}, ContourStyle -> colors, PlotPoints -> 50, MaxRecursion -> 4, FrameLabel -> (Style[#, 14] & /@ {w, e}), RotateLabel -> False, PlotLegends -> Placed[LineLegend[colors, {2/10, 8/10}, LegendLabel -> "a ="], {.7, .4}]]
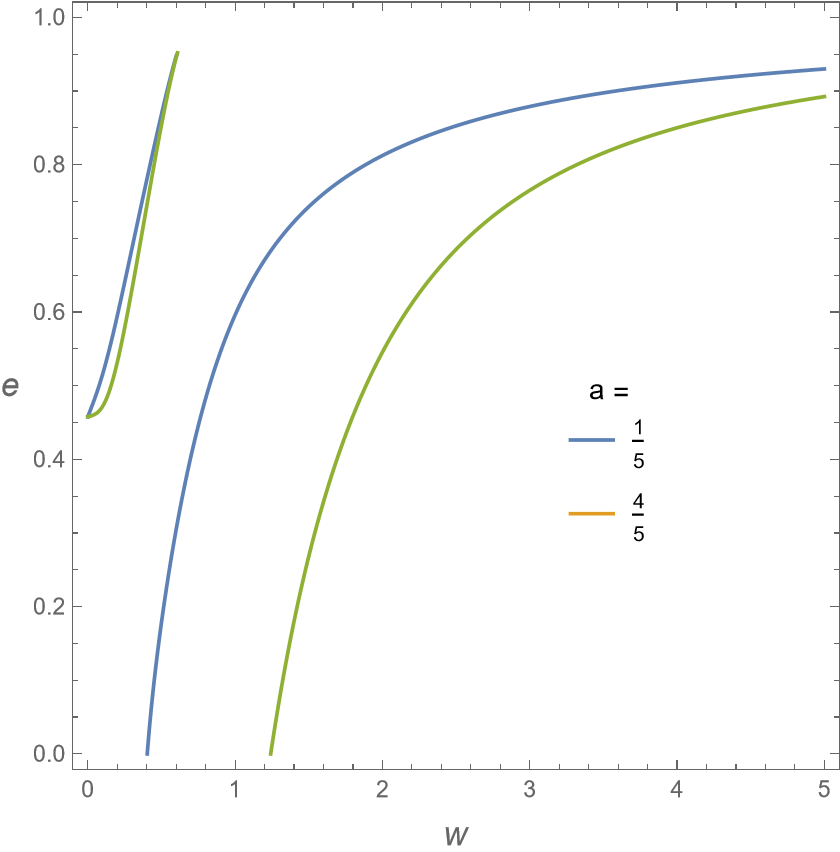
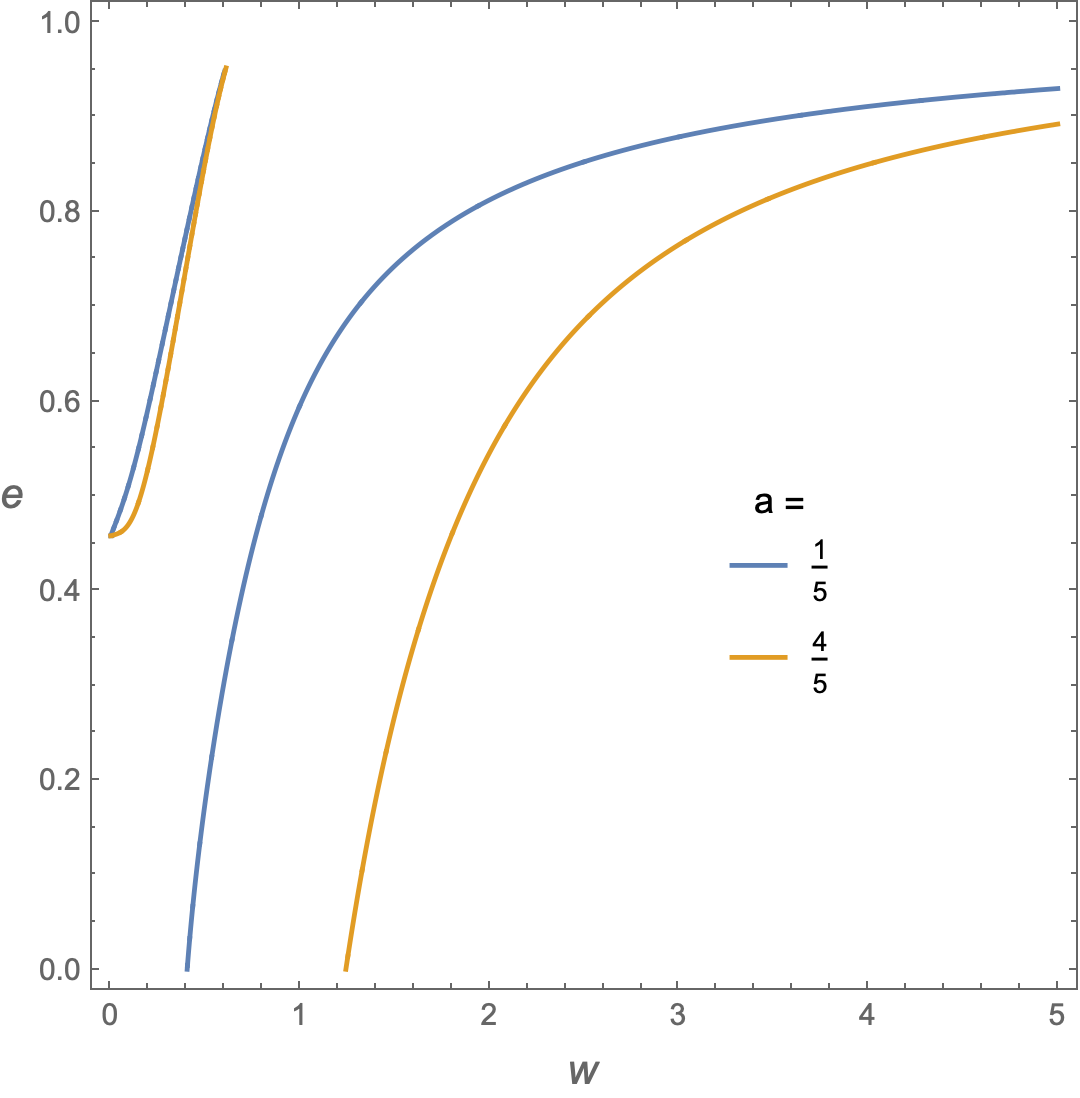
where I plotted two cases, $a=0.2$ and $a=0.8$, for the relation between $w$ and $e$, and the result is this:
As you can see, the colors of the plots and legends are different, green and orange!


