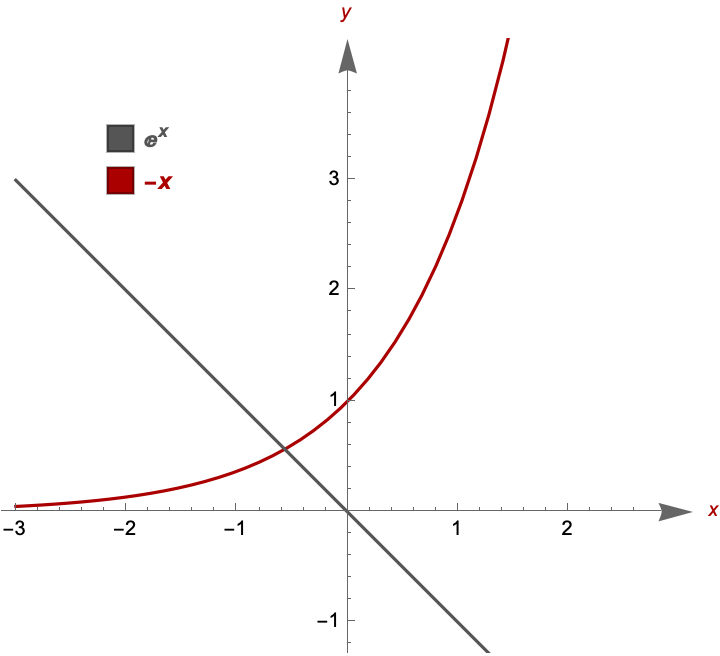
I cannot find a god solution to highlight the intersection point between these two curves, in the plot I made:
Clear[f, g, plot, reg];
f[x_] = Exp[x];
g[x_] = -x;
plot = Plot[{f[x], g[x]}, {x, -3, 3},
PlotStyle -> {Darker@Red, Darker@Gray}, AspectRatio -> Automatic,
PlotLegends ->
Placed[
 SwatchLegend[{Darker[Gray],
   Darker[Red]}, {Style[Exp[x], Darker[Gray], Bold],
   Style[Style[-x, Darker[Red], Bold]]},
  LegendMarkerSize -> {15, 15}], {0.2, 0.8}],
AxesLabel -> {Style[x, Darker[Red]], Style[y, Darker[Red]]}];
Show[plot, PlotRange -> {-1, 4}, AxesStyle -> Arrowheads[{0.05}],
 Axes -> True, Frame -> False,
 GridLines -> {{{{Thick, AbsoluteDashing[{3, 3}]}}}, None}]
Here is what I would like to to, but I'm unable to.
An empty circle, possibly in orange, around the intersection point between $e^x$ and $-x$.
Making the axes bold (I tried with bold and thickness, it didn't work)
Using a different font for axes label x and y
Anyway, more generally, I ask you: do you have some "good" improvement for this plot (or in general)?
I used to create plots with tikz, but I wanted to change a bit.
Thank you!

