2
$\begingroup$

We have the following periodic function.

$$f(x)=\begin{cases} x+2,& -2<x<0 \newline 2-2x, & 0<x<2 \end{cases}$$

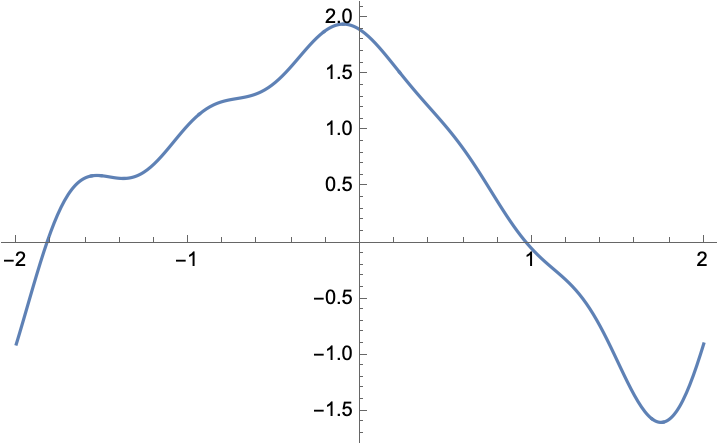
We define the function and we make the plot

f[x_] := Which[-2 < x < 0, x + 2, 0 < x < 2, 2 - 2 x]
Plot[f[x], {x, -2, 2}]

Plot[f[x], {x, -2, 2}]

L = 4;
a[n_] := (2/L)*Integrate[f[x]*Cos[2 n*Pi*x/L], {x, -L/2, L/2}]
a[0] := (1/L)*Integrate[f[x], {x, -L/2, L/2}]
b[n_] := (2/L)*Integrate[f[x]*Sin[2 n*Pi*x/L], {x, -L/2, L/2}]
F[x_, Nmax_] := 
 a[0] + Sum[a[n]*Cos[2 n*Pi*x/L] + b[n]*Sin[2 n*Pi*x/L], {n, 1, Nmax}]
p[Nmax_, a_] := 
 Plot[Evaluate[F[x, Nmax]], {x, -a, a}, PlotRange -> All, 
  PlotPoints -> 200]
f[x_] := If[x > 0, 2 - 2 x, x + 2];
a[n]
a[0]
b[n]
Simplify[%, n \[Element] Integers]
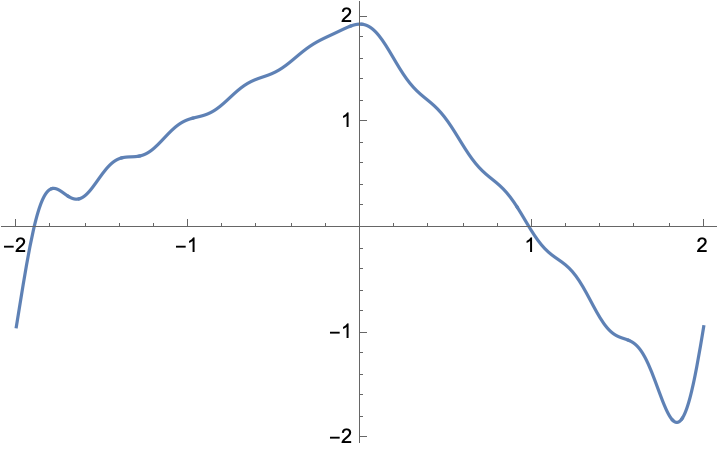
p[5, 2]
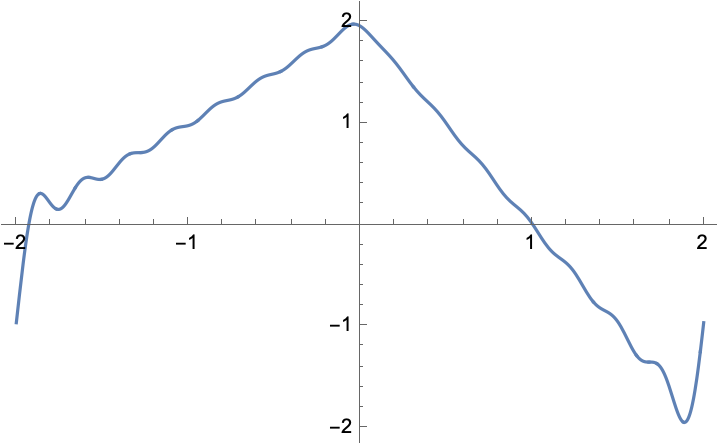
p[10, 2]
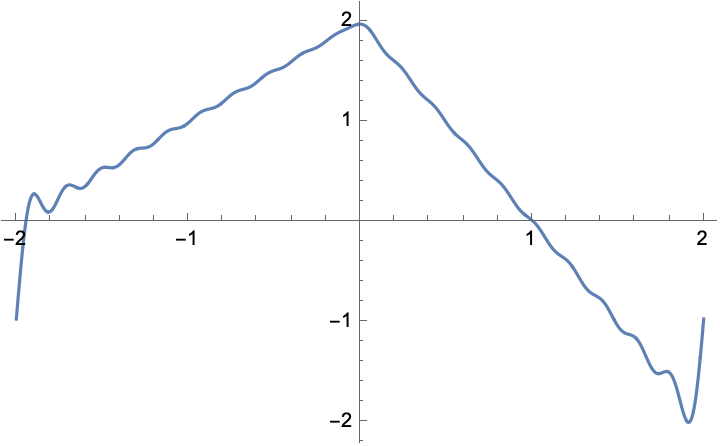
p[15, 2]
p[20, 2]

With the following 4 partial sum plots enter image description here enter image description here enter image description here enter image description here
Now we want to define an error function $E(x)=|f(x)-S_N(x)|$ where $S_n$ for the partial sums of the Fourier series of the above function for N=7,14,20. I would like to calculate its values at the points of a 10-point partition of the base interval $[-L,L]$ using the Table and Tableform commands.

We have already defined $S_n$ above as

F[x_, Nmax_] := 
 a[0] + Sum[a[n]*Cos[2 n*Pi*x/L] + b[n]*Sin[2 n*Pi*x/L], {n, 1, Nmax}]

Now I have defined $E(x)$

e[x_, Nmax_] := Abs[f[x] - F[x, Nmax]]

But I think I miss something. Any suggestions?

$\endgroup$

1 Answer 1

5
$\begingroup$

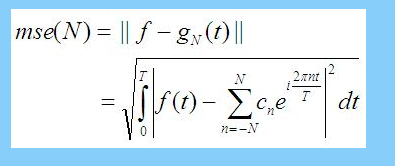
I think for Fourier series, you are supposed to use MSE (mean square error) to compare the performance of the approximation given by Fourier series against the real function. This I think is the common way to measure error with Fourier series.

The formula is

enter image description here

Integrate[Abs[f[x] - F[x, 10]]^2, {x, -L/2, L/2}];
Sqrt[%] // N

Mathematica graphics

Integrate[Abs[f[x] - F[x, 20]]^2, {x, -L/2, L/2}];
Sqrt[%] // N

Mathematica graphics

 Integrate[Abs[f[x] - F[x, 50]]^2, {x, -L/2, L/2}];
 Sqrt[%] // N

Mathematica graphics

You can see that mean square error goes down as more terms are added. Most of the error comes due to Gibbs. In theory, there will always be such an error at the ends, and this Gibbs error can't be eliminated no matter how many terms are used.

Update

If the question is asking to find Fourier series at specific x points of partition 10, then one way is (note the definition of f(x) is changed a little below from the question in order to include the end points and zero.

L = 4;
f[x_] := Which[-2 <= x <= 0, x + 2, 0 < x <= 2, 2 - 2 x]
a[n_] = (2/L)*Integrate[f[x]*Cos[2 n*Pi*x/L], {x, -L/2, L/2}]
a[0] = (1/L)*Integrate[f[x], {x, -L/2, L/2}]
b[n_] = (2/L)*Integrate[f[x]*Sin[2 n*Pi*x/L], {x, -L/2, L/2}]
F[x_, Nmax_] := 
 a[0] + Sum[a[n]*Cos[2 n*Pi*x/L] + b[n]*Sin[2 n*Pi*x/L], {n, 1, Nmax}]

(*divide the period into 10 equal intervals*)
partitions = Subdivide[-L/2, L/2, 10]

Mathematica graphics

(*evaluate F.S. approximation at each one of these points *)
Map[(F[x, 7] /. x -> #) &, partitions] // N

Mathematica graphics

 Map[(F[x, 10] /. x -> #) &, partitions] // N

Mathematica graphics

 Map[(F[x, 100] /. x -> #) &, partitions] // N

Mathematica graphics

 (*Compare to actual f(x)*)
 Map[f[#] &, partitions] // N

Mathematica graphics

Note that at end points the error is largest due to Gibbs but inside, the error goes down. This is why MSE is needed to calculate the error over the whole interval.

Update

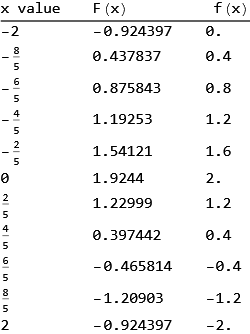
is it possible to write it with Table or TableForm

One way could be (for 10 partitions, using 7 number of terms)

partitions = Subdivide[-L/2, L/2, 10];
data = Table[z = partitions[[n]]; {z, N@F[z, 7], N[f[z]]}, {n, 1, 
    Length[partitions]}];
TableForm[data, TableHeadings -> {None, {"x value", "F(x)", " f(x)"}}]

Mathematica graphics

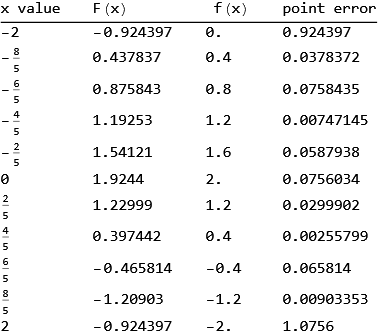
To add error column (pointwise error, not MSE error)

data = Table[z = partitions[[n]]; 
   error = Abs[N[F[z, 7] - f[z]]]; {z, N@F[z, 7], N[f[z]], error}, {n,
     1, Length[partitions]}];
TableForm[data, 
 TableHeadings -> {None, {"x value", "F(x)", " f(x)", "point error"}}]

Mathematica graphics

You can change the above as needed.

$\endgroup$
10
  • $\begingroup$ You chose $N=10,20,50$ to calculate the values of the points of a 10-point partition on the interval $[-L/2,L/2]$. Correct? $\endgroup$ Commented Jan 19, 2023 at 22:42
  • 1
    $\begingroup$ @AthanasiosParaskevopoulos I just gave examples of different N. You can choose N=10 for your needs. But the above is the formula. Only the first uses N=10 (with MSE error of .27), the others use a different N ofcourse. I just wanted to show the MSE goes down as N increases. You need to integrate over one period. I assumed you are asking how to find/calculate the error in approximation. $\endgroup$
    – Nasser
    Commented Jan 19, 2023 at 22:45
  • 1
    $\begingroup$ calculate its values at the points of a 10-point partition So you want the value of fApprximation(x,N)? It seems the question is asking to evaluate the F.S. at specific x points? In this case you can divide the period into 10 partitions and just evaluate F.S. at each one of these points using F[x,10]/.x->point ? I can't help with the interpretation of the question much, but that is what it sound it is asking. May be you can ask another student in the class or the teacher for clarification? I thought you are asking for error estimate, since that is what you wrote last thing. $\endgroup$
    – Nasser
    Commented Jan 19, 2023 at 22:58
  • 1
    $\begingroup$ @AthanasiosParaskevopoulos fyi, added partition also. $\endgroup$
    – Nasser
    Commented Jan 19, 2023 at 23:16
  • 1
    $\begingroup$ @AthanasiosParaskevopoulos fyi, added tableform $\endgroup$
    – Nasser
    Commented Jan 20, 2023 at 5:04

Your Answer

By clicking “Post Your Answer”, you agree to our terms of service and acknowledge you have read our privacy policy.

Not the answer you're looking for? Browse other questions tagged or ask your own question.