0
$\begingroup$

Edit 1:

Issues seem to emerge from within ImplicitRegion as well as Region Plot. Using $Surd[y^{2},{3}]$ or avoiding $y^{2/3}$ by using $y^{3}$ will result in a correct result of Integrate. Area and Integrate seem to return identical results.

In other case both the results of RegionPlot or Integrate[1,Element[{x,y},reg] of the following ImplicitRegion will be wrong, as verified by last result (In case no mistake was done):

$\text{reg7}=\text{ImplicitRegion}\left[\sin [x]\leq y\leq \cos [x],\left\{\left\{x,0,\frac{3 \pi }{2}\right\},y\right\}\right] $

The results and double checking them unfold as follows:

$\text{RegionPlot}[\text{reg7}]$ enter image description here
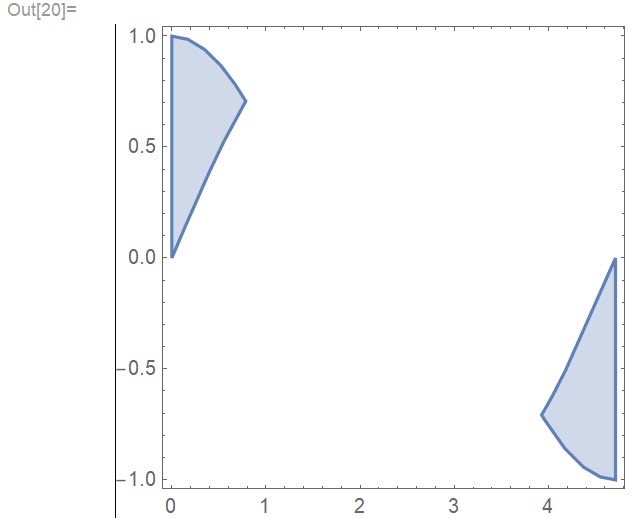
$\text{Integrate}[1,\{x,y\}\in \text{reg7}]$

$2 \left(\sqrt{2}-1\right)$

$\int_0^{\frac{3 \pi }{2}} \text{Abs}[ \cos [x]-\sin [x]] \, dx$

$2 \left(2 \sqrt{2}-1\right)$


Original Post:

I am trying to Integrate the area mentioned below using ImplicitRegion function, following this resource. This method worked in many other scenario. The plot was accurate, but the integration returned 1/10 which is not true as is verified by the traditional integration. I have tried integration over $-1\leq y\leq 0$ and $0\leq y\leq 1$ separately and also using Surd[x,3]^2 but things got much weirder. Can any one give a hint how I can improve or correct this?

$\text{reg}=\text{ImplicitRegion}\left[y\leq x\leq y^{\frac{2}{3}},\{x,\{y,-1,1\}\}\right]$

$\text{RegionPlot}[\text{reg}]$ enter image description here
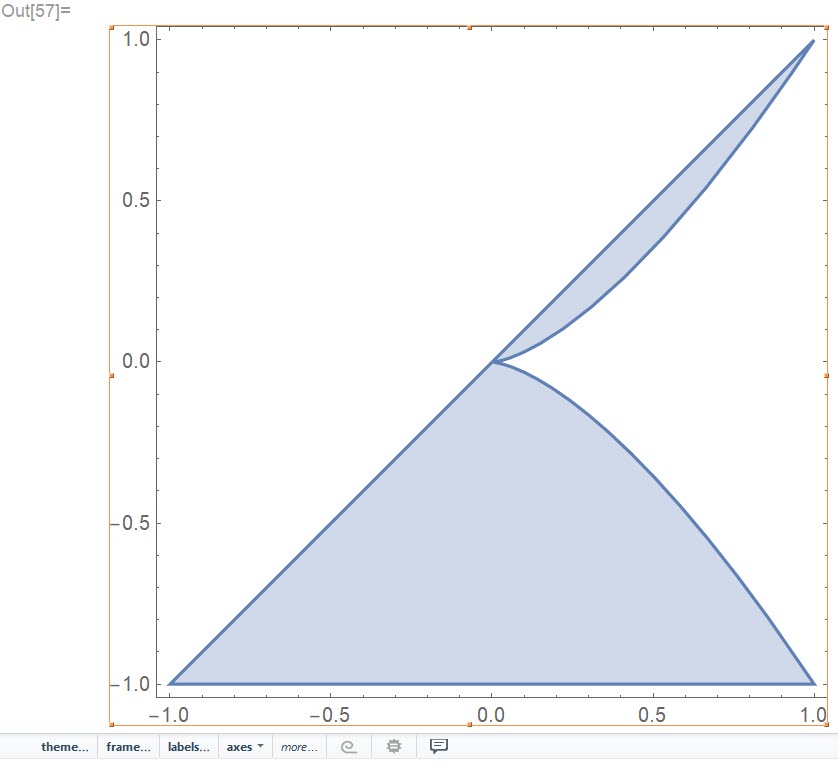
$\text{Integrate}[1,y\in \text{reg}]$

$\frac{1}{10}$

$\int_{-1}^1 \left(y^{\frac{2}{3}}-y\right) \, dy$

$\frac{3}{5} \left(1+(-1)^{2/3}\right)$

$\endgroup$
2
  • 2
    $\begingroup$ You can format inline code and code blocks by selecting the code and clicking the {} button above the edit window. The edit window help button ? is useful for learning how to format your questions and answers. You may also find this meta Q&A helpful $\endgroup$
    – Michael E2
    Commented Aug 14, 2020 at 12:47
  • 2
    $\begingroup$ The region between Sin[x] and Cos[x] is Min[Sin[x], Cos[x]] <= y <= Max[Sin[x], Cos[x]] instead of Sin[x] <= y <= Cos[x]. I have updated my answer. $\endgroup$
    – cvgmt
    Commented Aug 15, 2020 at 23:10

1 Answer 1

4
$\begingroup$

Updated answer.

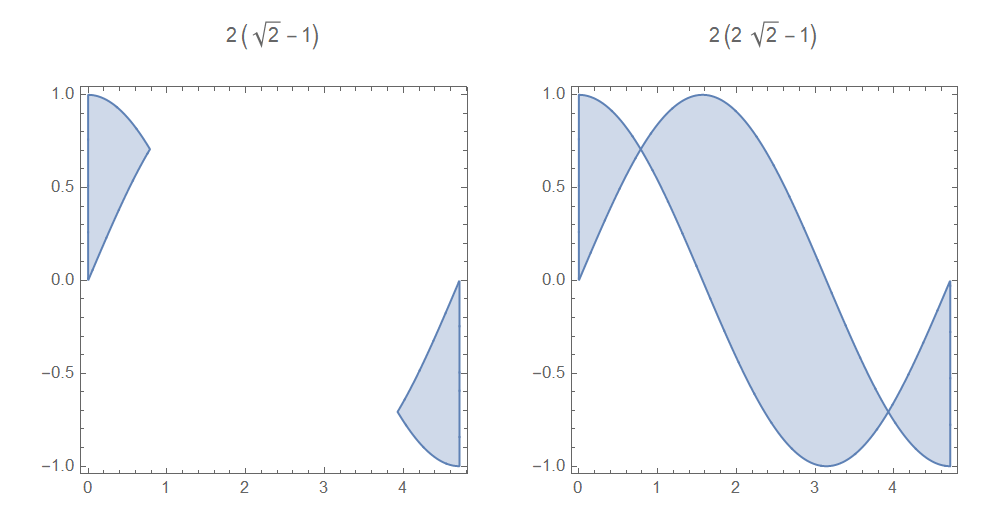
The region between Sin[x] and Cos[x] is Min[Sin[x], Cos[x]] <= y <= Max[Sin[x], Cos[x]] instead of Sin[x] <= y <= Cos[x]

BTW, since $\max(f,g)-\min(f,g)=|f-g|$,that is why your integrate work.

$$ \int_a^b |f(x)-g(x)|\,\mathrm{d}x =\int_a^b \left [ \max(f(x),g(x))-\min(f(x),g(x))\right ]\,\mathrm{d}x$$

The set $$\{ (x,y) : \sin(x)\leq y\leq \cos(x) \} $$ is equivalent to $$\{ (x,y) : \sin(x) \leq y\; \text{and} \; y\leq \cos(x) \}$$ which implicitly satisfy a another condition say $\sin(x)\leq \cos(x)$

regionOne = 
      ImplicitRegion[Sin[x] <= y <= Cos[x], {{x, 0, 3/2 \[Pi]}, y}];
    regionTwo = 
      ImplicitRegion[
       Min[Sin[x], Cos[x]] <= y <= 
        Max[Sin[x], Cos[x]], {{x, 0, 3/2 \[Pi]}, y}];
    {{RegionPlot[regionOne], 
      RegionMeasure[regionone]}, {RegionPlot[regionTwo], 
      RegionMeasure[regionTwo]}}

enter image description here

+++++++++++++++++++++++++++++++++++++++++++++++

Original answer

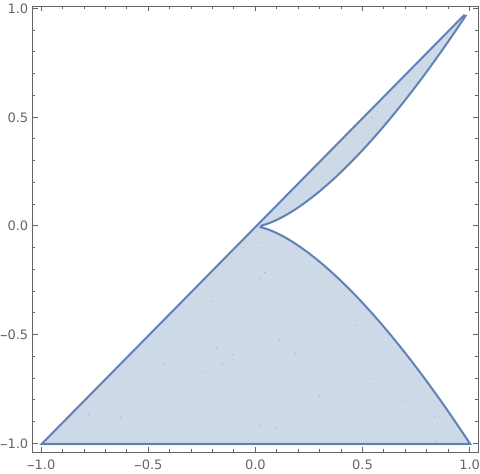
 reg = ImplicitRegion[y <= x <= CubeRoot[y]^2 && -1 <= y <= 1, {x, y}]
RegionPlot[
 DiscretizeRegion[reg, MaxCellMeasure -> {"Length" -> 0.012}]]
    Integrate[1, Element[{x, y}, reg]]
    Integrate[CubeRoot[y]^2 - y, {y, -1, 1}]

enter image description here

Or

reg = ImplicitRegion[y^3 <= x^3 <= y^2 && -1 <= y <= 1, {x, y}]
Integrate[1, Element[{x, y}, reg]]
$\endgroup$
5
  • 2
    $\begingroup$ Or Integrate[Surd[y^2, 3] - y, {y, -1, 1}]. $\endgroup$
    – user64494
    Commented Aug 14, 2020 at 12:21
  • $\begingroup$ @cvgmt RegionPlot would render an incorrect plot in your first option (Same with using Surd[y^2,3] @user64494), even though Integrate result is true, which why I came across it.The second option involves a changing of the formula itself. I am still not able to figure out why I get, either 1/10 instead of 6/5,or a false plot or in other case the formula has to be manipulated. $\endgroup$
    – pigeon
    Commented Aug 15, 2020 at 10:45
  • 1
    $\begingroup$ @pigeon It it the render problem of RegionPlot instead of CubeRoot or Surd $\endgroup$
    – cvgmt
    Commented Aug 15, 2020 at 12:08
  • 2
    $\begingroup$ @pigeon you can also do Area[reg] $\endgroup$
    – flinty
    Commented Aug 15, 2020 at 13:58
  • $\begingroup$ @flinty Despite seeing this many time, It just never crossed my mind due to the need to figure out how it works. It is just perfect in this scenario! Thanks $\endgroup$
    – pigeon
    Commented Aug 15, 2020 at 16:57

Your Answer

By clicking “Post Your Answer”, you agree to our terms of service and acknowledge you have read our privacy policy.

Not the answer you're looking for? Browse other questions tagged or ask your own question.