I'm new to using Mathematica, and I have a problem with plotting Fourier series partial sums.
In particular, my target is
to plot the Fourier series of my piecewise function and with that function on a single plot
and then to compare the genereted trigonometric polynomial with the original function to find point where they are closest to each other.
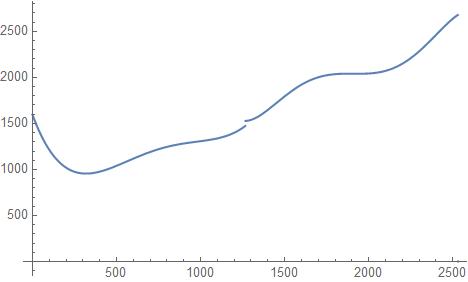
I started with this piecewise function which was generated by a previous fitting of my data.
f[x_] :=
  Piecewise[
    {{1595.6662770406633 - 4.968000370422044 x + 0.012672971318651484 x^2 -
        0.00001183377889695339 x^3 + 3.841543896820609*^-9 x^4,
      0 <= x < 1266.},
     {140884.53677307916 - 397.17060928335155 x + 0.44179779820265586 x^2 -
        0.0002399273183663781 x^3 + 6.376241982891033*^-8 x^4 -
          6.639720201538734*^-12 x^5,
      1266. <= x < 2530.}},
    0]
By hand, I calculated the Fourier coefficients (I hope they're correct) in this way:
a0 = (1/2529) Integrate[f[x], {x, 0, 2529}];
ak1 =
  Integrate[
    (1/2)(1595.67 - 4.968 x + 0.012673 x^2 - 0.0000118338 x^3 + (3.84154 x^4)/10^9) Cos[k π x/2],
    {x, 0, 1265},
    Assumptions -> k ∈ Integers];
ak2 =
  Integrate[
    (1/2)(140885. - 397.171 x + 0.441798 x^2 - 0.000239927 x^3 + (6.37624 x^4)/10^8 - (6.63972 x^5)/10^12) Cos[k π x/2],
    {x, 1266, 2592},
    Assumptions -> k ∈ Integers];
bk1 =
  Integrate[
    (1/2) Sin[k π x/2]*(1595.67 - 4.968 x + 0.012673 x^2 - 0.0000118338 x^3 + (3.84154 x^4)/10^9),
    {x, 0, 1265},
    Assumptions -> k ∈ Integers]];
bk2 =
  Integrate[
    (1/2)(140885. - 397.171 x + 0.441798 x^2 - 0.000239927 x^3 + (6.37624 x^4)/10^8 - (6.63972 x^5)/10^12) Sin[k π x/2],
   {x, 1266, 2529},
   Assumptions -> k ∈ Integers];
ak = FullSimplify[ak1 + ak2, k ∈ Integers]
bk = FullSimplify[bk1 + bk2, k ∈ Integers]
And then, to plot my partial sum, I defined:
s[n_, x_] := a0/2+(1/2530) Sum[ak Cos[(k π x)/2] + k Sin[(k π x)/2], {k, 1, n}]

partialsums = Table[s[n, x], {n, 1, 5}]

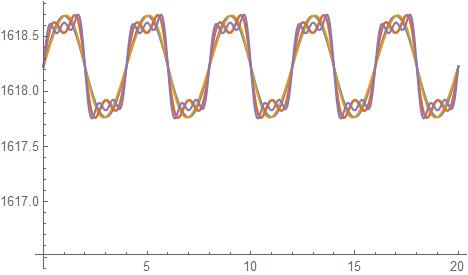
Plot[Evaluate[partialsums], {x, 0, 20}]
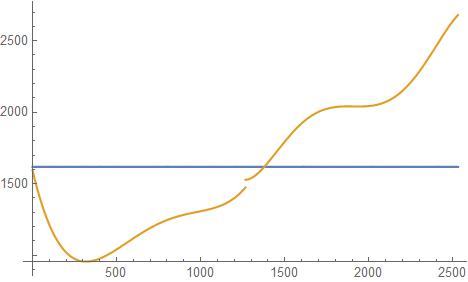
But the following is the result I see when I try to plot my partial sums and f together in a same range, for example, of 20.
Plot[{Evaluate[partialsums], f[x_]}, {x, 0, 20}]
In other words, Mathematica doesn't plot the partial sums together with my original function I want to compare it with.
I also tried with
Plot[{s[1, x], f[x_]}, {x, 0, 2530}]
But that doesn't work either. Moreover the function generated by the partial sums doesn't seem to follow the curvature of f and its amplitude.
I think I have probably made some mistakes in the calculus of the coefficients or in definition of variables, and until this is corrected, I can't go on with my analisys.
Could someone please help me?


Show[Plot[f1, {x,0,20}],Plot[f2,{x,0,20}]orPlot[{f1[x],f2[x]},{x,0,20}]. $\endgroup$Plot[Evaluate@Append[partialsums, f[x]], {x, 0, 20}, PlotRange -> All]? $\endgroup$f[x_]? what isprice? Furthera0should be divided by two, shouldn't be?... $\endgroup$SinandCosis not included ($1/2529$). Ins[n_,x_]definition,kshould bebk. Please, look for more typos and errors, it could there be more... $\endgroup$