I have a data set gathered from lab. The measurements are of the form {x, y, z}. I want to plot this data in a way that there is (1) no interpolation between adjacent data points and (2) that is visualised in the form of cubes, i.e. {x, y}, and give the location of the cuboid whilst z gives the height, and then repeat this simply for all data points.
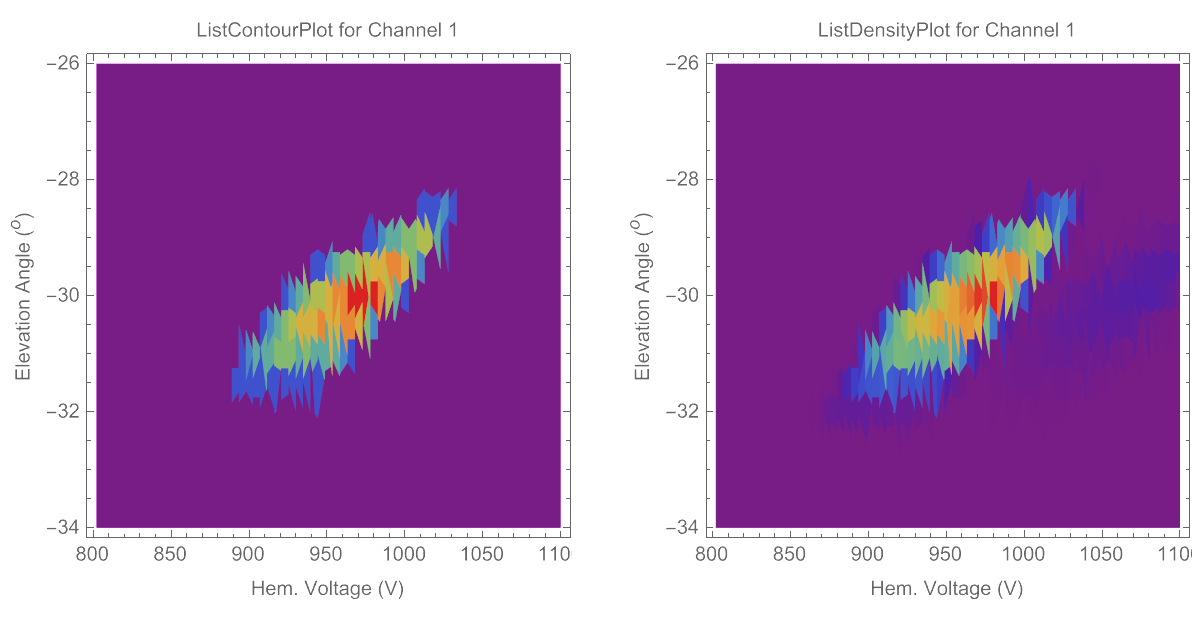
I have tried ListContourPlot and ListDensityPlot with InterpolationOrder -> 0, however I get wierd results. For example, both plots don't show the squares or rectangular patches that I was expecting, instead they seem more triangular.
I have attached an image of a couple of my plots:
And this is the code that I have used to generate these plots:
GraphicsGrid[{{ListContourPlot[scanDataCh1, Mesh -> None,
  InterpolationOrder -> 0, PlotRange -> All,
  ColorFunction -> "Rainbow",
  FrameLabel -> {"Hem. Voltage (V)",
  "Elevation Angle \!\(\*SuperscriptBox[\((\), \(o\)]\))",
  "ListContourPlot for Channel 1"}, ImageSize -> Large],
ListDensityPlot[scanDataCh1, Mesh -> None, InterpolationOrder -> 0,
  PlotRange -> All, ColorFunction -> "Rainbow",
  FrameLabel -> {"Hem. Voltage (V)",
  "Elevation Angle \!\(\*SuperscriptBox[\((\), \(o\)]\))",
  "ListDensityPlot for Channel 1"}, ImageSize -> Large]}}]
Thanks!


