3
$\begingroup$

I have a data set on the form of 3 spatial coordinates x,y,z and an amplitude. Here is a small crop of the data, :

{{0, 0, 0, 1.00448}, {0, 4, 0, 2.98714}, {0, 4, 0.010101, 2.98712}, {0.010101, 4, 0.010101, 2.9871}, {0, 4, 0.020202, 2.98713}, {0.010101, 4, 0.030303, 2.98709}, {0, 4, 0.030303, 2.9871}, {0.010101, 0, 0.050505, 1.00449}, {0, 0, 0.050505, 1.0045}, {0.010101, 4, 0.050505, 2.9871}}

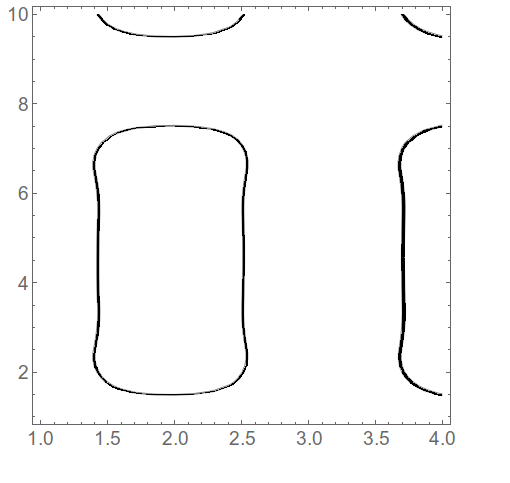
What I would like is a 2D-contour plot on the form x, y, amplitude, where the contour interface is represented by the values of amplitude within, say, 2.0 +/- 0.05. This is all I want, a black-colored contour on a white background.

First, what I do is to extract the data points that satisfy data[[:,3]] within 0 +/- 0.05, which I do using Select: Select[data, -0.05 < #[[3]] < +0.05 &]; Then I extract the points that satisfy that amplitude is within 2.0 +/- 0.05. This is easy, same procedure.

However, when I plot it using ListContourPlot, not only is the domain reduced, but the interface is still multicolored.

Is there a way to obtain a simple contour plot?

$\endgroup$
7
  • 1
    $\begingroup$ Am I reading correctly that you want basically one contour line, whose thickness is such that it would cover the area bounded by contours at 1.95 and 2.05? $\endgroup$
    – Jason B.
    Commented Oct 21, 2015 at 9:55
  • $\begingroup$ @JasonB That is exactly what I want. That will allow be to plot any cross section of the data and include as many data amplitudes as I desire $\endgroup$
    – BillyJean
    Commented Oct 21, 2015 at 9:56
  • $\begingroup$ I just noticed the dimensions of your data, that you have three dimensions and an amplitude but you want to plot only as a function of 2 - what do you want to do with the z coordinate? $\endgroup$
    – Jason B.
    Commented Oct 21, 2015 at 10:24
  • $\begingroup$ @JasonB I extract the data points that satisfy data[[:,3]] within 0 +/- 0.05, I made a note of it in my OP $\endgroup$
    – BillyJean
    Commented Oct 21, 2015 at 11:00
  • 1
    $\begingroup$ Ahhh, so it wasnt' clear what you were looking for. You want a 2D slice of your 3D contour plot I believe. If your data came from a function f[x,y,z], then you want a contour plot of f[x,y,2.0+delta] where delta is summed from plus/minus 0.05. Is that correct? $\endgroup$
    – Jason B.
    Commented Oct 21, 2015 at 11:11

1 Answer 1

4
$\begingroup$

Here I'm just drawing two contour lines at the boundaries you set, and shading the region between them black and the rest of the image white. With more data it may look better and you won't have to use the InterpolationOrder option.

Try this:

ListContourPlot[data, InterpolationOrder -> 2, 
 Contours -> {1.95, 2.05}, ContourShading -> {White, Black}, 
 PlotRange -> All, ContourStyle -> Black]

enter image description here

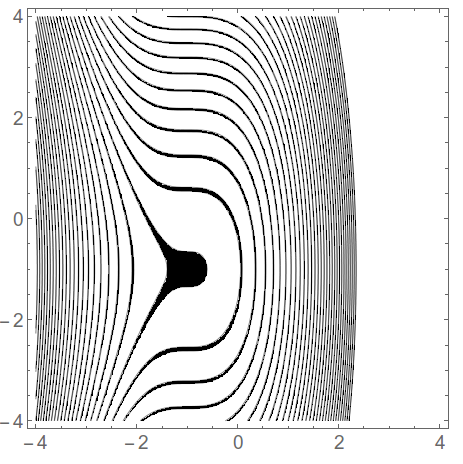
Edit: You can set it to do multiple contours lines like this

data2 = Flatten[
   Table[{x, y, .8 (x + 1)^3 + .4 (y + 1)^2}, {x, -4, 4, .1}, {y, -4,4, .1}], 1];
width = 0.1;
ListContourPlot[data2, 
 Contours -> Flatten@Table[n + width {-.5, .5}, {n, -30, 30}], 
 ContourShading -> {White, Black}, PlotRange -> All, 
 ContourStyle -> Black]

enter image description here

$\endgroup$

Your Answer

By clicking “Post Your Answer”, you agree to our terms of service and acknowledge you have read our privacy policy.

Not the answer you're looking for? Browse other questions tagged or ask your own question.