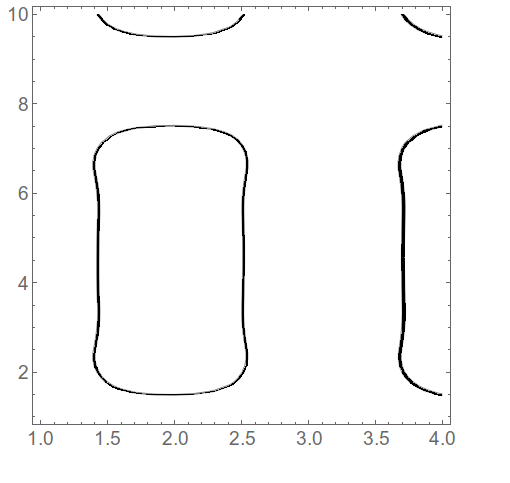
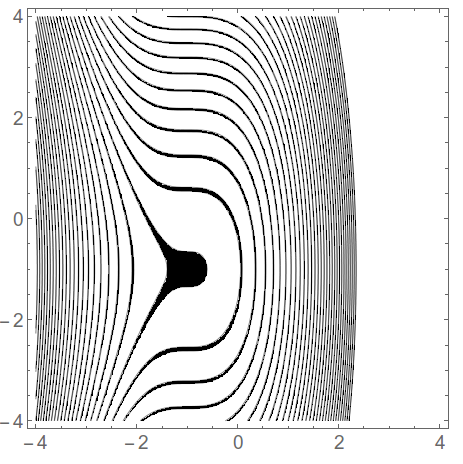
Here I'm just drawing two contour lines at the boundaries you set, and shading the region between them black and the rest of the image white. With more data it may look better and you won't have to use the InterpolationOrder option.
Try this:
ListContourPlot[data, InterpolationOrder -> 2,
 Contours -> {1.95, 2.05}, ContourShading -> {White, Black, White},
 PlotRange -> All, ContourStyle -> Black]
Edit: You can set it to do multiple contours lines like this
data2 = Flatten[
   Table[{x, y, .8 (x + 1)^3 + .4 (y + 1)^2}, {x, -4, 4, .1}, {y, -4,4, .1}], 1];
width = 0.1;
ListContourPlot[data2,
 Contours -> Flatten@Table[n + width {-.5, .5}, {n, -30, 30}],
 ContourShading -> {White, Black}, PlotRange -> All,
 ContourStyle -> Black]


