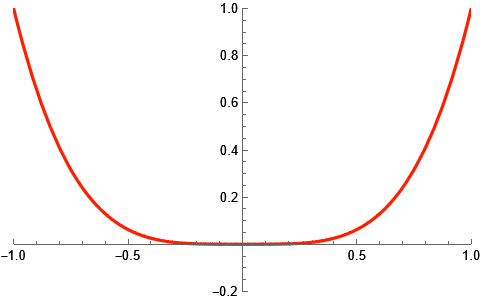
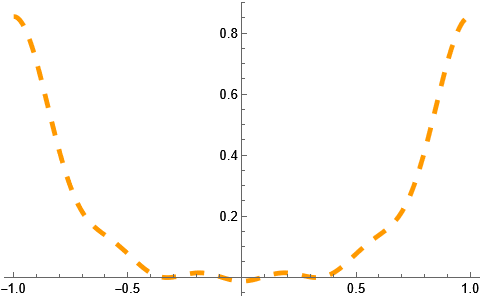
1
$\begingroup$

enter image description here

f[x_] = x^4; a = -1; b = 1; L = 1; 
gr = Plot[f[x], {x, a, b}, PlotRange -> {{a, b}, {-0.2, 1}}, 
   PlotStyle -> {Hue[0.02], Thickness[0.007]}];

a0 = 1/L \!\(
\*SubsuperscriptBox[\(\[Integral]\), \(-1\), \(1\)]\(f[
      x] \[DifferentialD]x\)\);
a[n_] = 1/L \!\(
\*SubsuperscriptBox[\(\[Integral]\), \(-1\), \(1\)]\(f[x]*Cos[
\*FractionBox[\(n*\[Pi]\), \(L\)]*x] \[DifferentialD]x\)\);
b[n_] = 1/L \!\(
\*SubsuperscriptBox[\(\[Integral]\), \(-1\), \(1\)]\(f[x]*Sin[
\*FractionBox[\(n*\[Pi]\), \(L\)]*x] \[DifferentialD]x\)\);
\[CapitalPhi][x, k] = a0/2 + \!\(
\*UnderoverscriptBox[\(\[Sum]\), \(n = 1\), \(k\)]\((a[n]*Cos[
\*FractionBox[\(n*\[Pi]*x\), \(L\)]] + b[n]*Sin[
\*FractionBox[\(n*\[Pi]*x\), \(L\)]])\)\) // N;
\[CapitalPhi]1 = a0/2 + \!\(
\*UnderoverscriptBox[\(\[Sum]\), \(n = 1\), \(1\)]\((a[n]*Cos[
\*FractionBox[\(n*\[Pi]*x\), \(L\)]] + b[n]*Sin[
\*FractionBox[\(n*\[Pi]*x\), \(L\)]])\)\) // N;

gr1 = Plot[\[CapitalPhi]1, {x, a, b}, 
  PlotStyle -> {Hue[0.1], Dashing[{0.03}], Thickness[0.01]}]

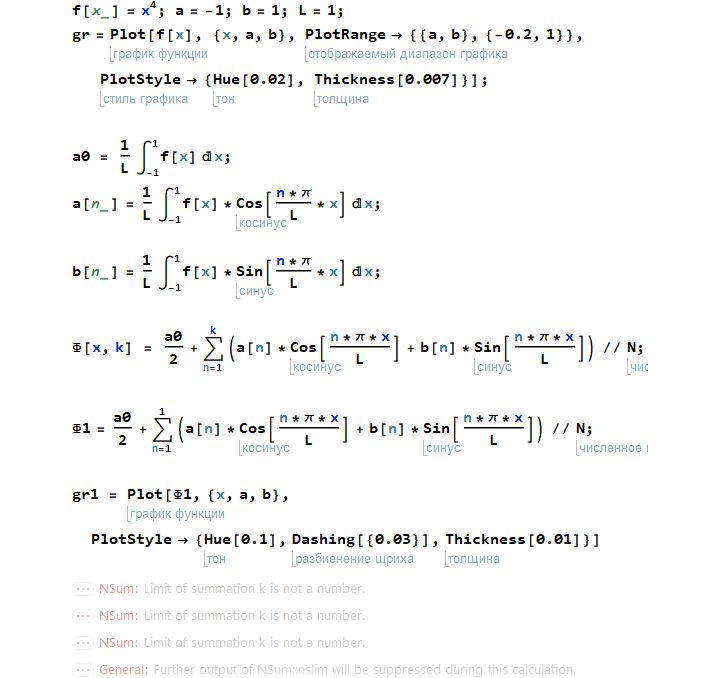
I'm a beginner, I was given a lab, I copied exactly the code from the picture that the teacher sent us, but my code does not work like his. Unfortunately, I can't ask him about my mistake, so I'm asking here

$\endgroup$
3
  • 1
    $\begingroup$ There are errors like in the picture hard to copy code from images. Better post plain text code. But I see problems with your Phi[x,k] = .... may be you meant Phi[x_,k_]:=... instead. You are also not use Phi anywhere. So why is it even there? $\endgroup$
    – Nasser
    Commented May 13, 2022 at 17:26
  • $\begingroup$ @Nasser I'm a beginner, I was given a lab, I copied exactly the code from the picture that the teacher sent us, but my code does not work like his. Unfortunately, I can't ask him about my mistake, so I'm asking here. Phi[x,k] = .... our teacher wrote this. If i try Phi[x_,k_]:=... it's not help. Sorry for my english. $\endgroup$
    – Casper
    Commented May 13, 2022 at 17:40
  • $\begingroup$ As the error messages state, k is not defined. $\endgroup$
    – bbgodfrey
    Commented May 13, 2022 at 21:08

1 Answer 1

4
$\begingroup$

Your teacher code has lots of problems.

Try this notebook

You have used a and b as numbers, then later defined a[...] as function. So Mathematica did 1[...] It is also better to define functions that accepts all its arguments, not half of them. So changed your a[n_] to a[n_,x_] since x shows on the RHS.

You are also not using Φ[x_, k_] so have no idea why the teacher has it there.

Clear["Global`*"]
f[x_] := x^4; 
aValue = -1; 
bValue = 1; 
L = 1; 
gr = Plot[f[x], {x, aValue, bValue}, 
  PlotRange -> {{aValue, bValue}, {-0.2, 1}}, 
     PlotStyle -> {Hue[0.02], Thickness[0.007]}]

Mathematica graphics

a0 = (1/L)*Integrate[f[x], {x, -1, 1}]
a[n_, x_] := (1/L)*Integrate[f[x]*Cos[((n*Pi)/L)*x], {x, -1, 1}]
b[n_, x_] := (1/L)*Integrate[f[x]*Sin[((n*Pi)/L)*x], {x, -1, 1}]
Φ[x_, k_] := N[a0/2 + Sum[a[n, x]*Cos[(n*Pi*x)/L] + b[n, x]*Sin[(n*Pi*x)/L], {n, 1, k}]]
Φ1 = N[a0/2 + Sum[a[n, x]*Cos[(n*Pi*x)/L] + b[n, x]*Sin[(n*Pi*x)/L], {n, 1, 5}]]
gr1 = Plot[Φ1, {x, aValue, bValue}, PlotStyle -> {Hue[0.1], Dashing[{0.03}], Thickness[0.01]}]

Mathematica graphics

Since you are doing Fourier series in Mathematica, this web page has lots of such Fourier series animation all done using Mathematica.

$\endgroup$
0

Not the answer you're looking for? Browse other questions tagged or ask your own question.