Plot[{y*Cot[x]*(((Tan[180/4 + x/2]^2)*Exp[180*Tan[x]]) - 1) +  16.86*0.8*
((Tan[180/4 + x/2]^2)*Exp[180*Tan[x]]) + 0.018*16.86*Tan[x]*((Tan[180/4 +
x/2]^2)*Exp[180*Tan[x]] + 1) - 2320, y + 0.000789*((2320 - (16.86*0.8 + 2*(1 -
Sin[x])*16.86*0.8)/3)/((16.86*0.8 + 2*(1 - Sin[x])*16.86*0.8)/3))*(Tan[2*x/3])
- 21.66}, {x, 20, 80}, {y, 20, 80}]
$\begingroup$
$\endgroup$
2
1 Answer
$\begingroup$
$\endgroup$
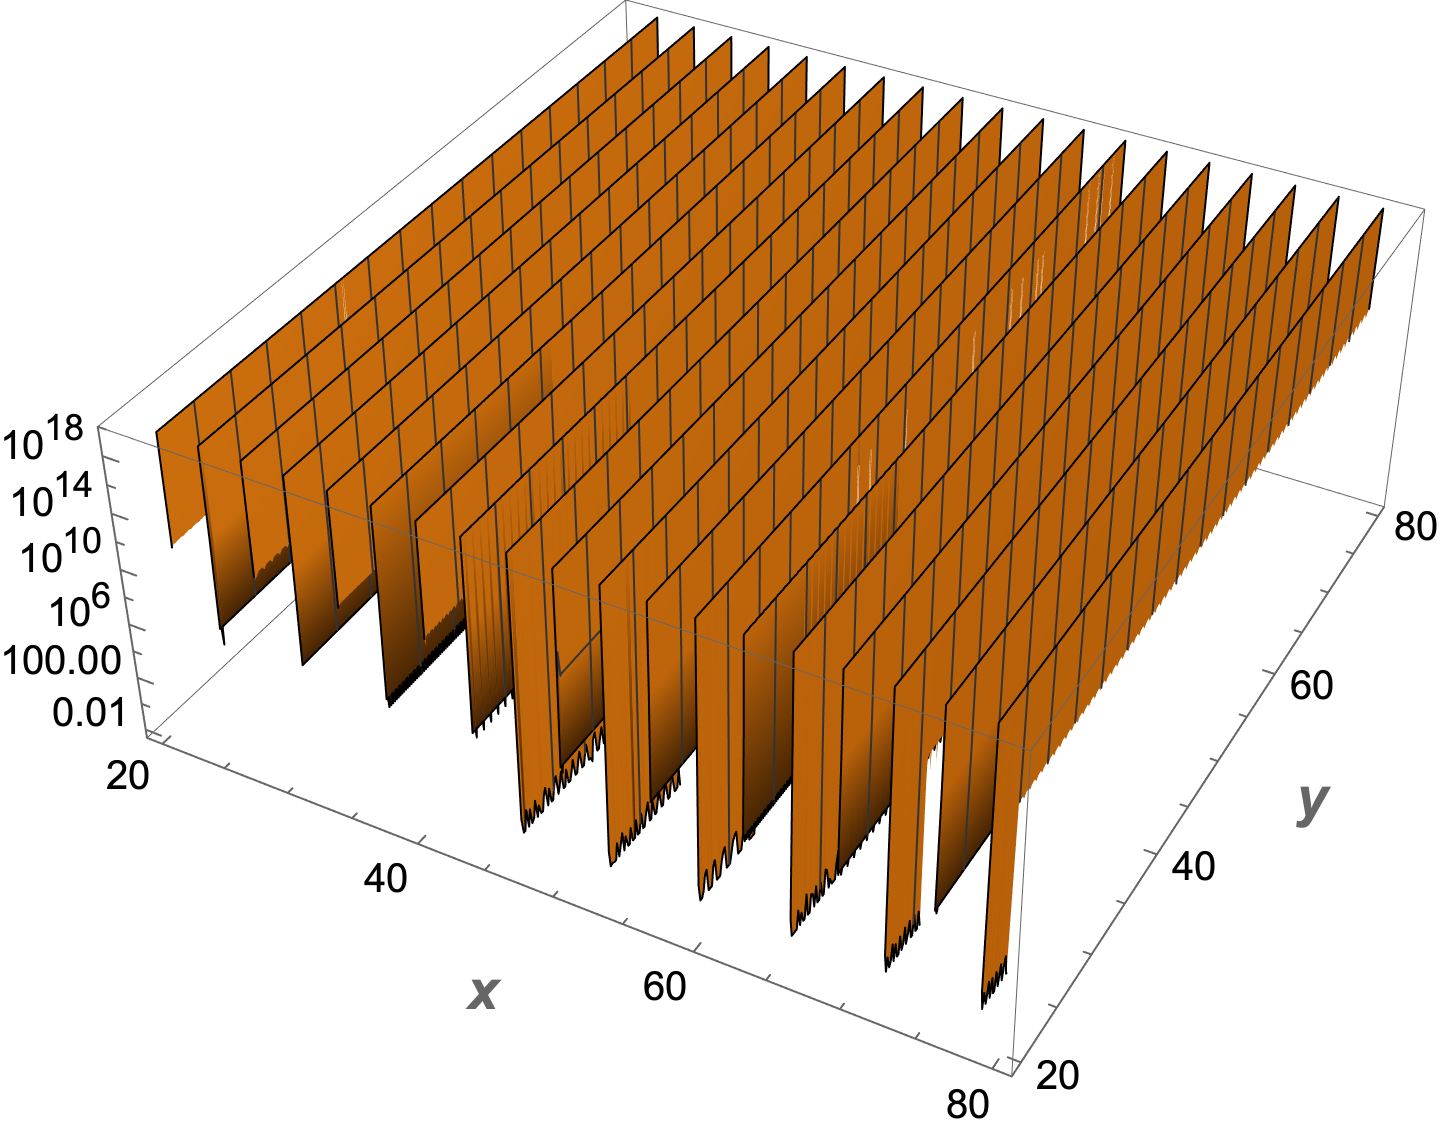
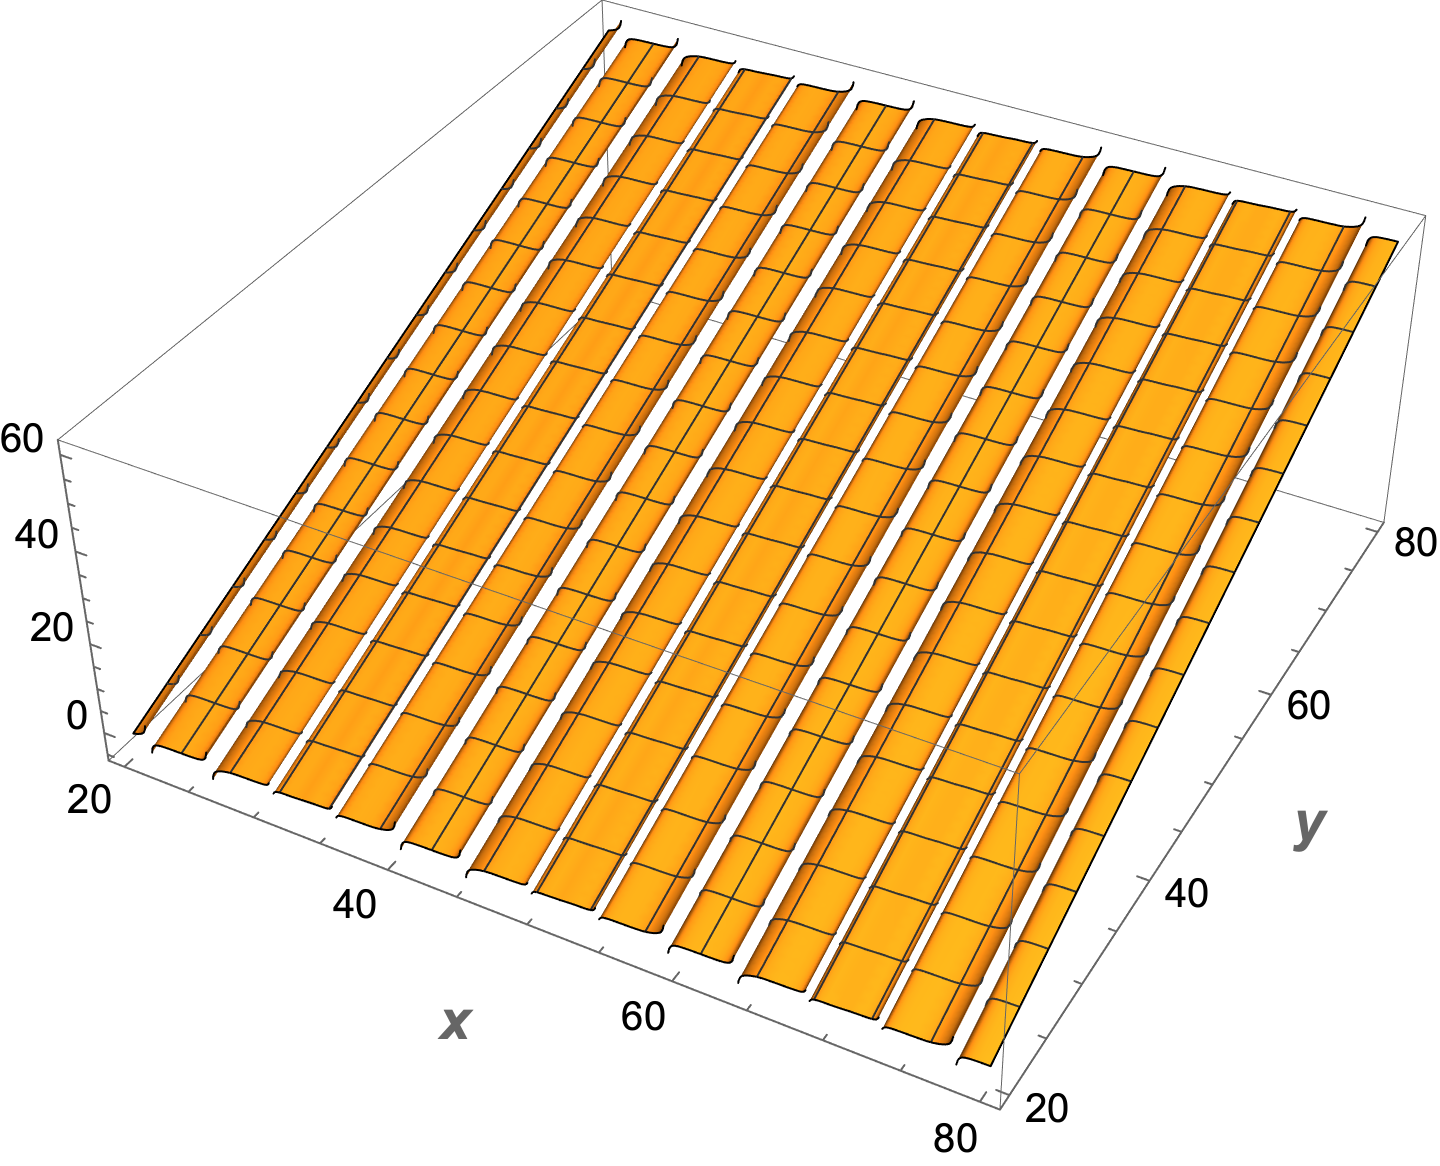
In addition to the corrections mentioned by Nasser, since the scale of the functions are radically different, they should be plotted in separate plots.
$Version

(* "12.3.0 for Mac OS X x86 (64-bit) (May 10, 2021)" *)

Clear["Global`*"]

funcs = {y Cot[x] (((Tan[180/4 + x/2]^2) Exp[180 Tan[x]]) - 1) +
      16.860 .8 ((Tan[180/4 + x/2]^2) Exp[180 Tan[x]]) +
      0.01816 .86 Tan[x] ((Tan[180/4 + x/2]^2) Exp[180 Tan[x]] + 1) - 2320,
     y + 0.000789 ((2320 - (16.860 .8 + 2 (1 - Sin[x]) 16.860 .8)/
            3)/((16.860 .8 + 2 (1 - Sin[x]) 16.860 .8)/3)) (Tan[2 x/3]) -
      21.66} // Rationalize // Simplify;
The plots are very slow.
Plot3D[funcs[[1]], {x, 20, 80}, {y, 20, 80},
 ScalingFunctions -> "Log",
 PlotRange -> {0, 10^20},
 PlotPoints -> 75,
 MaxRecursion -> 3,
 ClippingStyle -> None,
 ImageSize -> Medium,
 AxesLabel -> (Style[#, 14, Bold] & /@ {HoldForm[x], HoldForm[y]}),
 WorkingPrecision -> 15]
Plot3D[funcs[[2]], {x, 20, 80}, {y, 20, 80},
 PlotPoints -> 75,
 MaxRecursion -> 3,
 ClippingStyle -> None,
 ImageSize -> Medium,
 AxesLabel -> (Style[#, 14, Bold] & /@ {HoldForm[x], HoldForm[y]}),
 WorkingPrecision -> 15]


yCot[x]toy Cot[x]and changePlottoPlot3Dand see if this works. $\endgroup$