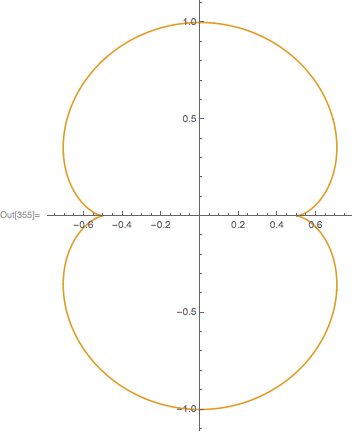
In fact, I want to plot the envelope of
$ \qquad F=y-\sin(t)-\tan(2t)(x-\cos t)=0 \quad s.t.\quad\partial F/\partial t =0$
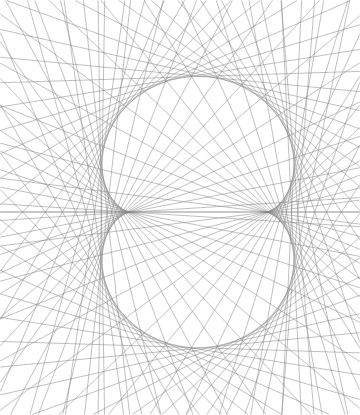
Here's how to quickly visualize an envelope of lines:
With[{n = 100},
     env = Graphics[{Directive[Opacity[1/2, Gray], Thin],
                     Table[InfiniteLine[{Cos[t], Sin[t]}, {1, Tan[2 t]}],
                           {t, 0, 2 π, 2 π/(n - 1)}]}]]
Generate the parametric equations of the envelope:
Simplify[{x, Tan[2 t] (x - Cos[t]) + Sin[t]} /.
First[Solve[D[Tan[2 t] (x - Cos[t]) + Sin[t], t] == 0, x]]]
   {(3 Cos[t] - Cos[3 t])/4, Sin[t]^3}
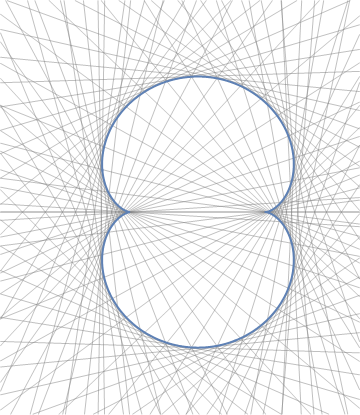
and show the lines and the curve together:
Show[env,
     ParametricPlot[{(3 Cos[t] - Cos[3 t])/4, Sin[t]^3}, {t, 0, 2 π}, PlotStyle -> Thick]]
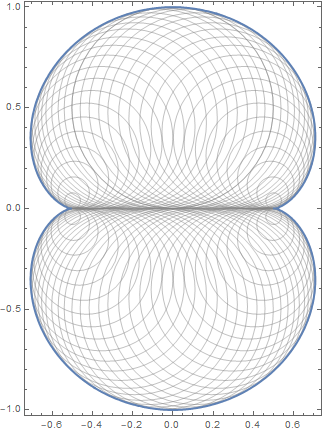
As a bonus (and also as a demonstration on how to handle more complicated envelopes), here's another way to generate a nephroid, as the envelope of circles:
With[{circ = #.# &[{x, y} - {Sin[t]/2, Cos[t]/2}] - (Cos[t]/2)^2},
     neph = Simplify[First[GroebnerBasis[Append[{circ, D[circ, t]},
                                                Cos[t]^2 + Sin[t]^2 - 1],
                                         {x, y}, {Cos[t], Sin[t]}]]/y]]
   64 x^6 + 12 x^2 (1 - 4 y^2)^2 + 48 x^4 (-1 + 4 y^2) + (-1 + y^2) (1 + 8 y^2)^2

With[{n = 81},
     Show[Graphics[{Directive[Opacity[1/2, Gray], Thin],
                    Table[Circle[{Sin[t]/2, Cos[t]/2}, Abs[Cos[t]/2]],
                          {t, 0, 2 π, 2 π/(n - 1)}]}, Frame -> True],
          ContourPlot[neph == 0, {x, -3/4, 3/4}, {y, -1, 1}, ContourStyle -> Thick]]


sin your command line? $\endgroup$