1
$\begingroup$

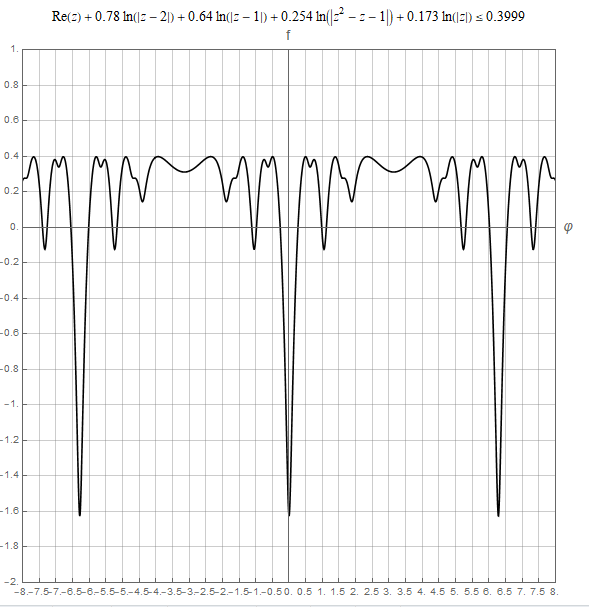
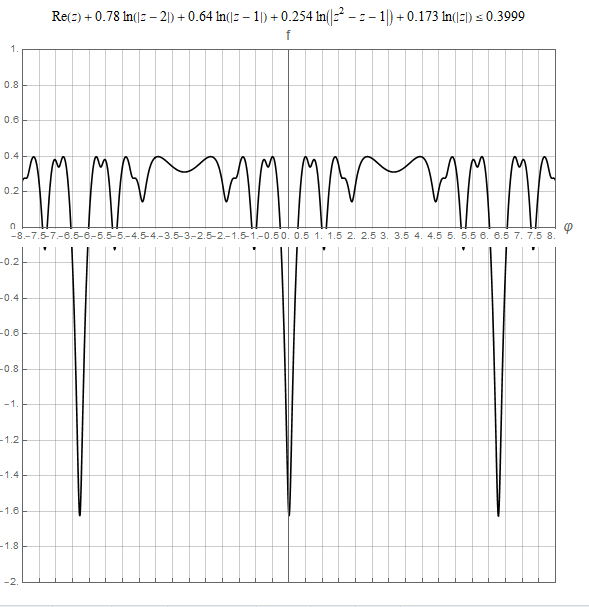
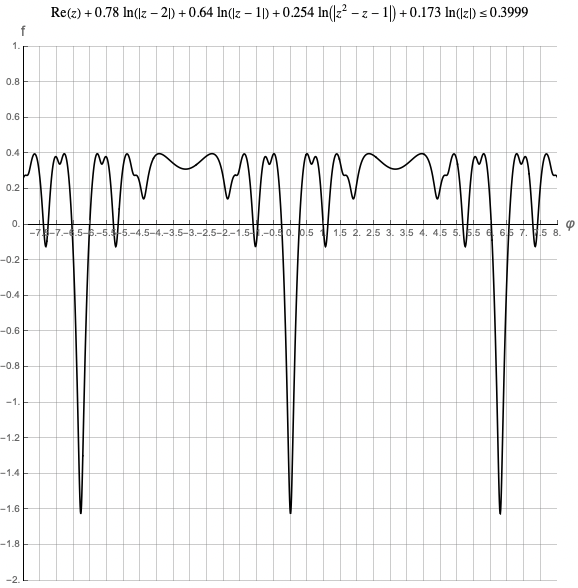
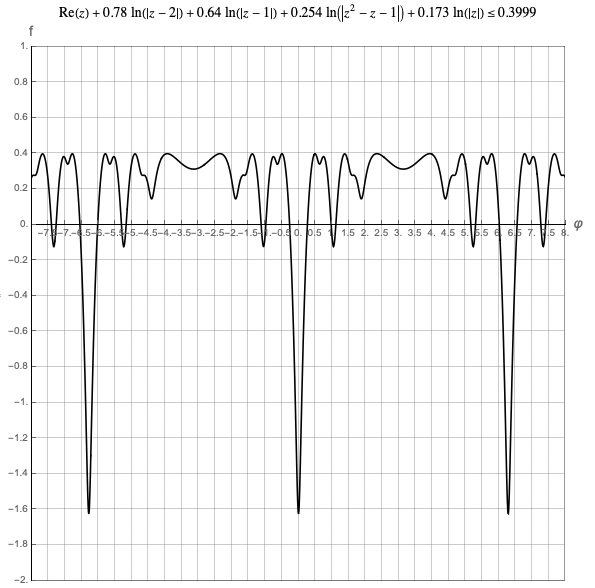
Please, help moving the digits up to the φ-axis like on the second screenshot. Thank you in advance.

Plot[
 With[{z = 1.1*E^(I u) + 0.908*E^(-I u)}, 
  Re[z] + 0.78*Log[Abs[z - 2]] + 0.64*Log[Abs[z - 1]] + 
   0.254*Log[Abs[z^2 - z - 1]] + 0.173*Log[Abs[z]]], {u, -15, 15},
 PlotStyle -> {Black},
 PlotRange -> {{-8, 8}, {-2, 1}},
 AspectRatio -> 1,
 AxesLabel -> (Style[#, 14] & /@ {"\[CurlyPhi]", "f"}),
 GridLines -> {Range[-8, 8, .5], Range[-2, 1, .2]},
 Frame -> True,
 FrameTicks -> {{Range[-2, 1, .2], Automatic}, {Range[-8, 8, .5], 
    Automatic}}, 
 PlotLabel -> 
  Style[TraditionalForm[
    HoldForm[
     Re[z] + 0.78*ln[Abs[z - 2]] + 0.64*ln[Abs[z - 1]] + 
       0.254*ln[Abs[z^2 - z - 1]] + 0.173*ln[Abs[z]] <= 0.3999]], 
   "TR", Black, 14],
 ImageSize -> Large]
enter image description here

enter image description here

$\endgroup$
4
  • $\begingroup$ Try adding AxesOrigin -> {0, 0} inside your Plot expression. $\endgroup$
    – MarcoB
    Commented Dec 2, 2020 at 0:23
  • $\begingroup$ Please change the title of this question to something specific and descriptive. $\endgroup$
    – Szabolcs
    Commented Dec 2, 2020 at 8:11
  • $\begingroup$ The title might more clearly reflect your question as, "How to position the Axes and Ticks of a plot?" $\endgroup$
    – Jagra
    Commented Dec 3, 2020 at 0:21
  • 1
    $\begingroup$ You have received 2 answers to your question. Both answers, the result of thoughtful work from the individuals that provided the answers. The value of this site comes from good questions & the community's & questioner's assessment of the answers provided. I urge you to review the answers with the same attention your question has recieved. Then, where the answers helped, up-vote the answer. If one solves your problem check it as "the answer". If you want or need something beyond that provided, clarify what you need with a comment. The site becomes more valuable when we all participate. $\endgroup$
    – Jagra
    Commented Dec 4, 2020 at 17:57

2 Answers 2

1
$\begingroup$

Ticks and Frame don't play well together. This get's you part of the way (Note edited 1 Dec 11:20 PM EST) ...

    Plot[
 With[{z = 1.1*E^(I u) + 0.908*E^(-I u)}, 
  Re[z] + 0.78*Log[Abs[z - 2]] + 0.64*Log[Abs[z - 1]] + 
   0.254*Log[Abs[z^2 - z - 1]] + 0.173*Log[Abs[z]]], {u, -15, 15},
 PlotStyle -> {Black},
 PlotRange -> {{-8, 8}, {-2, 1}},
 AspectRatio -> 1,
 AxesLabel -> (Style[#, 14] & /@ {"\[CurlyPhi]", "f"}),
 GridLines -> {Range[-8, 8, .5], Range[-2, 1, .2]},
 
 AxesOrigin -> {-8, 0},
 Ticks -> {Range[-8, 8, .5], Range[-2, 1, .2]},
 
 (* Frame->True, *)
 (* FrameTicks->{{Range[-2,1,.2],Automatic},None}, *)
 
 PlotLabel -> 
  Style[TraditionalForm[
    HoldForm[
     Re[z] + 0.78*ln[Abs[z - 2]] + 0.64*ln[Abs[z - 1]] + 
       0.254*ln[Abs[z^2 - z - 1]] + 0.173*ln[Abs[z]] <= 0.3999]], 
   "TR", Black, 14],
 ImageSize -> Large]
enter image description here

The solution does not have a Frame as your original solution did, perhaps someone can suggest how to add one (See new edit below).

I'll give it some more thought.

After some more thought a bit of a funky solution messing around with GridLines to give the Plot a pseudo Frame. I welcome any more elegant suggestions ;-) ...

Plot[
 With[{z = 1.1*E^(I u) + 0.908*E^(-I u)}, 
  Re[z] + 0.78*Log[Abs[z - 2]] + 0.64*Log[Abs[z - 1]] + 
   0.254*Log[Abs[z^2 - z - 1]] + 0.173*Log[Abs[z]]], {u, -15, 15},
 PlotStyle -> {Black},
 PlotRange -> {{-8, 8}, {-2, 1}},
 AspectRatio -> 1,
 AxesLabel -> (Style[#, 14] & /@ {"\[CurlyPhi]", "f"}),
 GridLines -> {AppendTo[
    Range[-8, 7.5, .5], {8, {Thickness[0.0025], Black}}],
   AppendTo[
    AppendTo[
     Range[-2, 
      0.8, .2], {1, {Thickness[0.0005], Black}}], {-2, {Thickness[
       0.0005], Black}}]},
 AxesOrigin -> {-8, 0},
 Ticks -> {Range[-8, 8, .5], Range[-2, 1, .2]},
 PlotLabel -> 
  Style[TraditionalForm[
    HoldForm[
     Re[z] + 0.78*ln[Abs[z - 2]] + 0.64*ln[Abs[z - 1]] + 
       0.254*ln[Abs[z^2 - z - 1]] + 0.173*ln[Abs[z]] <= 0.3999]], 
   "TR", Black, 14],
 ImageSize -> Large]

enter image description here

$\endgroup$
2
  • $\begingroup$ Hi Jagra! Thank you very much! Everything is perfect but the f axis is gone. How do you return it. Also, right and bottom lines of the frame are gone. $\endgroup$
    – Kristina
    Commented Dec 2, 2020 at 13:45
  • $\begingroup$ @Kristina -- See updates. $\endgroup$
    – Jagra
    Commented Dec 2, 2020 at 18:01
1
$\begingroup$

Define a function that constructs ticks and labels from a list of horizontal tick positions and a value for the vertical position:

ClearAll[newTicks]
newTicks[lst_, y_: 0] := {AbsoluteThickness[0.5], GrayLevel[.4], 
   Line[{#, Offset[{0, 5}, #]}],
   Text[Framed[Style[#[[1]], GrayLevel[.4]], FrameMargins -> 0, 
      FrameStyle -> None, Background -> White], Offset[{0, -5}, #], {0, 1}]} & /@ 
   Thread[{lst, y}];

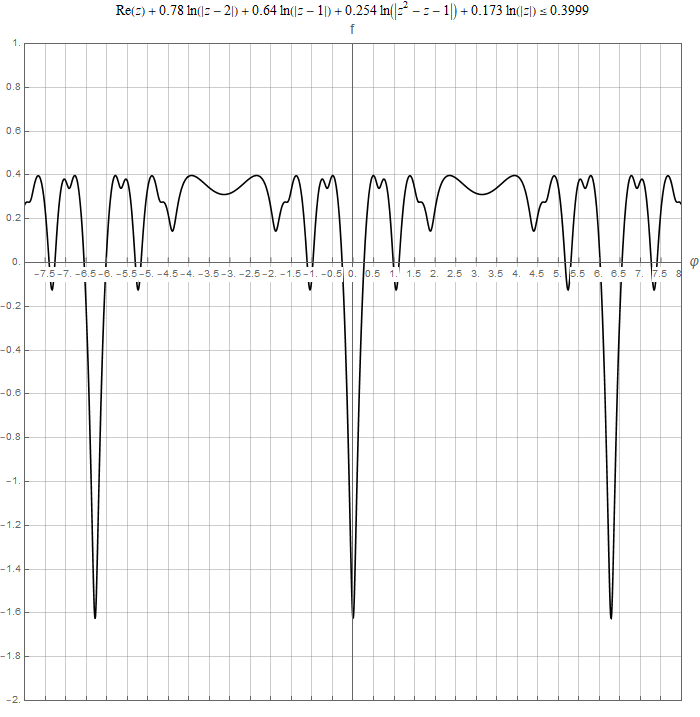
Use newTicks[Rest[Range[-8, 8, .5]]] as Epilog in your plot and add the option FrameTicksStyle to make the tick labels in lower frame invisible (FontOpacity -> 0):

Plot[With[{z = 1.1*E^(I u) + 0.908*E^(-I u)}, 
  Re[z] + 0.78*Log[Abs[z - 2]] + 0.64*Log[Abs[z - 1]] + 
   0.254*Log[Abs[z^2 - z - 1]] + 0.173*Log[Abs[z]]], {u, -15, 15}, 
 PlotStyle -> {Black}, PlotRange -> {{-8, 8}, {-2, 1}}, 
 AspectRatio -> 1, 
 AxesLabel -> (Style[#, 14] & /@ {"φ", "f"}), 
 GridLines -> {Range[-8, 8, .5], Range[-2, 1, .2]}, Frame -> True, 
 FrameTicks -> {{Range[-2, 1, .2], Automatic}, {Range[-8, 8, .5], Automatic}},
 FrameTicksStyle -> {{Automatic, Automatic}, {FontOpacity -> 0, Automatic}},
 Epilog -> newTicks[Rest[Range[-8, 8, .5]]], 
 PlotLabel -> Style[TraditionalForm[HoldForm[
     Re[z] + 0.78*ln[Abs[z - 2]] + 0.64*ln[Abs[z - 1]] + 
       0.254*ln[Abs[z^2 - z - 1]] + 0.173*ln[Abs[z]] <= 0.3999]], 
   "TR", Black, 14], ImageSize -> 700]

enter image description here

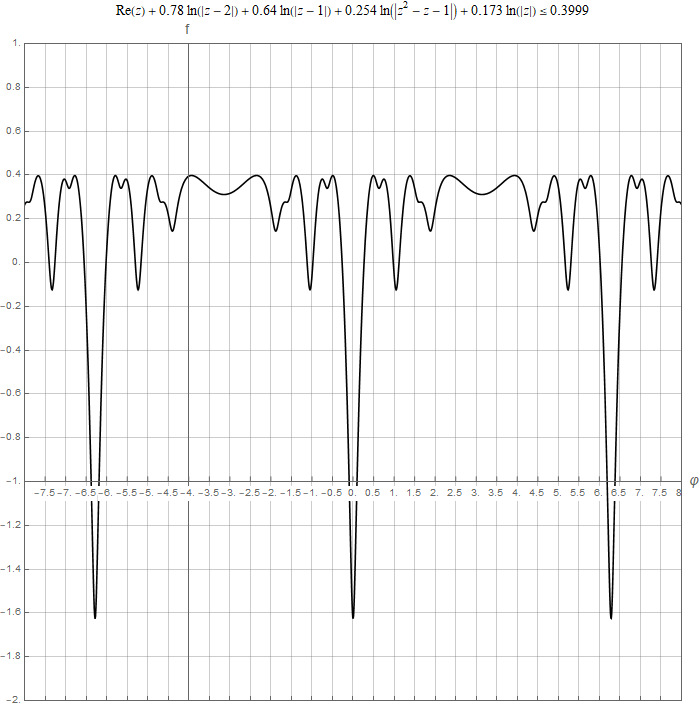
Use Epilog -> newTicks[Rest[Range[-8, 8, .5]], -1] and add the option AxesOrigin -> {-4, -1} to get:

enter image description here

$\endgroup$

Your Answer

By clicking “Post Your Answer”, you agree to our terms of service and acknowledge you have read our privacy policy.

Not the answer you're looking for? Browse other questions tagged or ask your own question.