Clarification
Source Link
Jagra
  • 14.6k
  • 1
  • 39
  • 82

The solution does not have a Frame as your original solution did, perhaps someone can suggest how to add one (See new edit below).

After some more thought a bit of a funky solution messing around with GridLines to give the Plot a pseudo Frame. I welcome any more elegant suggestions ;-) ...

The solution does not have a Frame as your original solution did, perhaps someone can suggest how to add one.

After some more thought a bit of a funky solution messing around with GridLines to give the Plot a pseudo Frame...

The solution does not have a Frame as your original solution did, perhaps someone can suggest how to add one (See new edit below).

After some more thought a bit of a funky solution messing around with GridLines to give the Plot a pseudo Frame. I welcome any more elegant suggestions ;-) ...

updated solution
Source Link
Jagra
  • 14.6k
  • 1
  • 39
  • 82

TicksTicks and FrameFrame don't play well together. This get's you part of the way (Note edited 1 Dec 11:20 PM EST) ...

I'll give it some more thought.

After some more thought a bit of a funky solution messing around with GridLines to give the Plot a pseudo Frame...

Plot[
 With[{z = 1.1*E^(I u) + 0.908*E^(-I u)}, 
  Re[z] + 0.78*Log[Abs[z - 2]] + 0.64*Log[Abs[z - 1]] + 
   0.254*Log[Abs[z^2 - z - 1]] + 0.173*Log[Abs[z]]], {u, -15, 15},
 PlotStyle -> {Black},
 PlotRange -> {{-8, 8}, {-2, 1}},
 AspectRatio -> 1,
 AxesLabel -> (Style[#, 14] & /@ {"\[CurlyPhi]", "f"}),
 GridLines -> {AppendTo[
    Range[-8, 7.5, .5], {8, {Thickness[0.0025], Black}}],
   AppendTo[
    AppendTo[
     Range[-2, 
      0.8, .2], {1, {Thickness[0.0005], Black}}], {-2, {Thickness[
       0.0005], Black}}]},
 AxesOrigin -> {-8, 0},
 Ticks -> {Range[-8, 8, .5], Range[-2, 1, .2]},
 PlotLabel -> 
  Style[TraditionalForm[
    HoldForm[
     Re[z] + 0.78*ln[Abs[z - 2]] + 0.64*ln[Abs[z - 1]] + 
       0.254*ln[Abs[z^2 - z - 1]] + 0.173*ln[Abs[z]] <= 0.3999]], 
   "TR", Black, 14],
 ImageSize -> Large]
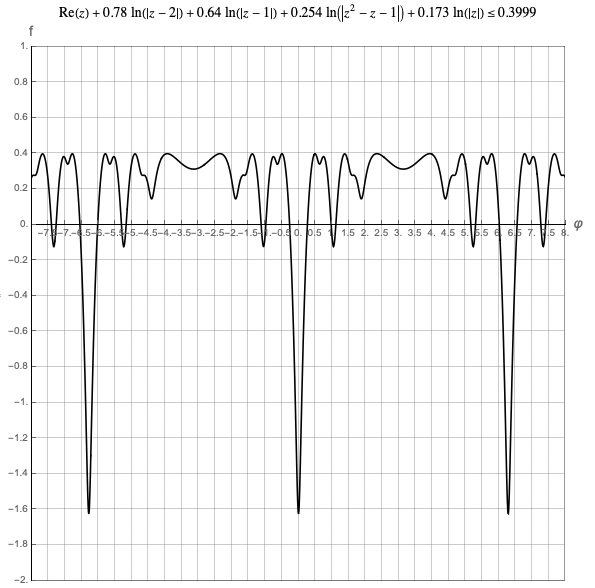
enter image description here

Ticks and Frame don't play well together. This get's you part of the way (Note edited 1 Dec 11:20 PM EST) ...

I'll give it some more thought.

Ticks and Frame don't play well together. This get's you part of the way (Note edited 1 Dec 11:20 PM EST) ...

I'll give it some more thought.

After some more thought a bit of a funky solution messing around with GridLines to give the Plot a pseudo Frame...

Plot[
 With[{z = 1.1*E^(I u) + 0.908*E^(-I u)}, 
  Re[z] + 0.78*Log[Abs[z - 2]] + 0.64*Log[Abs[z - 1]] + 
   0.254*Log[Abs[z^2 - z - 1]] + 0.173*Log[Abs[z]]], {u, -15, 15},
 PlotStyle -> {Black},
 PlotRange -> {{-8, 8}, {-2, 1}},
 AspectRatio -> 1,
 AxesLabel -> (Style[#, 14] & /@ {"\[CurlyPhi]", "f"}),
 GridLines -> {AppendTo[
    Range[-8, 7.5, .5], {8, {Thickness[0.0025], Black}}],
   AppendTo[
    AppendTo[
     Range[-2, 
      0.8, .2], {1, {Thickness[0.0005], Black}}], {-2, {Thickness[
       0.0005], Black}}]},
 AxesOrigin -> {-8, 0},
 Ticks -> {Range[-8, 8, .5], Range[-2, 1, .2]},
 PlotLabel -> 
  Style[TraditionalForm[
    HoldForm[
     Re[z] + 0.78*ln[Abs[z - 2]] + 0.64*ln[Abs[z - 1]] + 
       0.254*ln[Abs[z^2 - z - 1]] + 0.173*ln[Abs[z]] <= 0.3999]], 
   "TR", Black, 14],
 ImageSize -> Large]

enter image description here

updated solution
Source Link
Jagra
  • 14.6k
  • 1
  • 39
  • 82

Ticks and Frame don't play well together. This get's you part of the way (Note edited 1 Dec 11:20 PM EST) ...

    Plot[
 With[{z = 1.1*E^(I u) + 0.908*E^(-I u)}, 
  Re[z] + 0.78*Log[Abs[z - 2]] + 0.64*Log[Abs[z - 1]] + 
   0.254*Log[Abs[z^2 - z - 1]] + 0.173*Log[Abs[z]]], {u, -15, 15},
 PlotStyle -> {Black},
 PlotRange -> {{-8, 8}, {-2, 1}},
 AspectRatio -> 1,
 AxesLabel -> (Style[#, 14] & /@ {"\[CurlyPhi]", "f"}),
 GridLines -> {Range[-8, 8, .5], Range[-2, 1, .2]},
 
 AxesOrigin -> {0-8, 0},
 Ticks -> {Range[-8, 8, .5], NoneRange[-2, 1, .2]},
 
 (* Frame ->True, *)
 (* FrameTicks-> {{Range[-2,1,.2],Automatic},None}, *)
 
 PlotLabel -> 
  Style[TraditionalForm[
    HoldForm[
     Re[z] + 0.78*ln[Abs[z - 2]] + 0.64*ln[Abs[z - 1]] + 
       0.254*ln[Abs[z^2 - z - 1]] + 0.173*ln[Abs[z]] <= 0.3999]], 
   "TR", Black, 14],
 ImageSize -> Large]

enter image description hereenter image description here

You could add a tick scale to the left side and show it with the plot inThe solution does not have a Row[ ]Frame as your original solution did, perhaps someone can suggest how to add one.

I'll give it some more thought.

Ticks and Frame don't play well together. This get's you part of the way...

Plot[
 With[{z = 1.1*E^(I u) + 0.908*E^(-I u)}, 
  Re[z] + 0.78*Log[Abs[z - 2]] + 0.64*Log[Abs[z - 1]] + 
   0.254*Log[Abs[z^2 - z - 1]] + 0.173*Log[Abs[z]]], {u, -15, 15},
 PlotStyle -> {Black},
 PlotRange -> {{-8, 8}, {-2, 1}},
 AspectRatio -> 1,
 AxesLabel -> (Style[#, 14] & /@ {"\[CurlyPhi]", "f"}),
 GridLines -> {Range[-8, 8, .5], Range[-2, 1, .2]},
 
 AxesOrigin -> {0, 0},
 Ticks -> {Range[-8, 8, .5], None},
 
 (* Frame ->True, *)
 (* FrameTicks-> {{Range[-2,1,.2],Automatic},None}, *)
 
 PlotLabel -> 
  Style[TraditionalForm[
    HoldForm[
     Re[z] + 0.78*ln[Abs[z - 2]] + 0.64*ln[Abs[z - 1]] + 
       0.254*ln[Abs[z^2 - z - 1]] + 0.173*ln[Abs[z]] <= 0.3999]], 
   "TR", Black, 14],
 ImageSize -> Large]
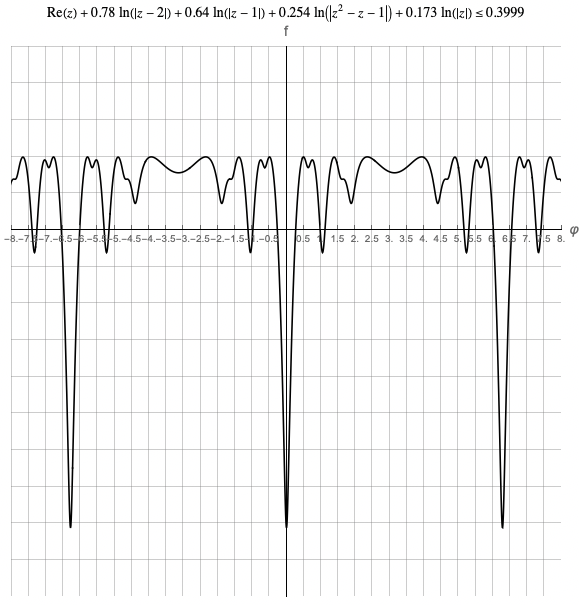
enter image description here

You could add a tick scale to the left side and show it with the plot in a Row[ ]

I'll give it some more thought.

Ticks and Frame don't play well together. This get's you part of the way (Note edited 1 Dec 11:20 PM EST) ...

    Plot[
 With[{z = 1.1*E^(I u) + 0.908*E^(-I u)}, 
  Re[z] + 0.78*Log[Abs[z - 2]] + 0.64*Log[Abs[z - 1]] + 
   0.254*Log[Abs[z^2 - z - 1]] + 0.173*Log[Abs[z]]], {u, -15, 15},
 PlotStyle -> {Black},
 PlotRange -> {{-8, 8}, {-2, 1}},
 AspectRatio -> 1,
 AxesLabel -> (Style[#, 14] & /@ {"\[CurlyPhi]", "f"}),
 GridLines -> {Range[-8, 8, .5], Range[-2, 1, .2]},
 
 AxesOrigin -> {-8, 0},
 Ticks -> {Range[-8, 8, .5], Range[-2, 1, .2]},
 
 (* Frame->True, *)
 (* FrameTicks->{{Range[-2,1,.2],Automatic},None}, *)
 
 PlotLabel -> 
  Style[TraditionalForm[
    HoldForm[
     Re[z] + 0.78*ln[Abs[z - 2]] + 0.64*ln[Abs[z - 1]] + 
       0.254*ln[Abs[z^2 - z - 1]] + 0.173*ln[Abs[z]] <= 0.3999]], 
   "TR", Black, 14],
 ImageSize -> Large]
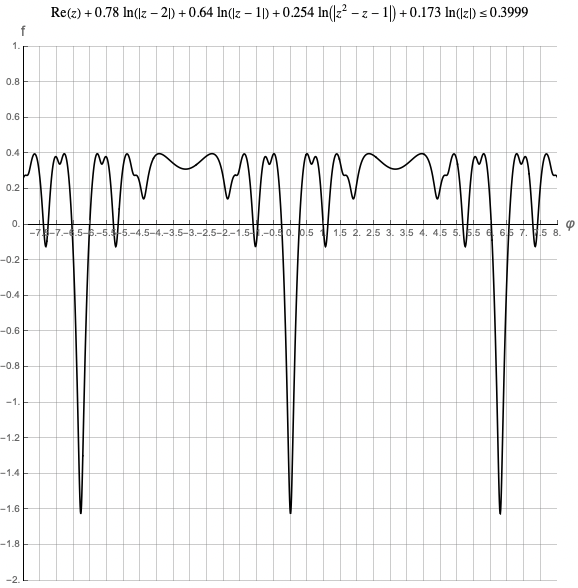
enter image description here

The solution does not have a Frame as your original solution did, perhaps someone can suggest how to add one.

I'll give it some more thought.

Source Link
Jagra
  • 14.6k
  • 1
  • 39
  • 82
Loading