1
$\begingroup$

I am plotting a graph which has about 196 nodes.

GraphPlot[{1 -> 24, 2 -> 24, 20 -> 364, 20 -> 779, 21 -> 130, ...
               378 -> 386, 492 -> 841, 779 -> 783, 839 -> 841}, 
     DirectedEdges -> False, VertexLabeling -> True, 
     Method -> "SpringElectricalEmbedding", 
     PackingMethod -> "ClosestPackingCenter"]

However when the output is produced it looks like below where many of the nodes are overlapping. How to tell Mathematica to produce a large picture so that no nodes overlap. True this might not be practical for very large graphs, but for 196 nodes, I would like no node to overlap another.
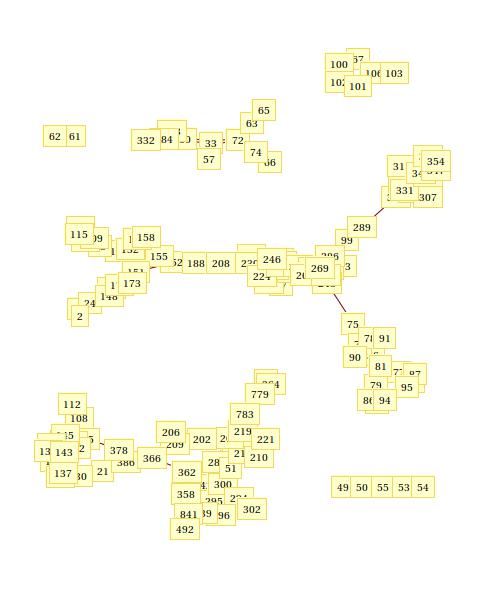
enter image description here

$\endgroup$
3
  • $\begingroup$ What if you resize the picture in the front end? $\endgroup$ Commented Jun 5, 2013 at 18:59
  • $\begingroup$ Yes, that does reduce the problem greatly, but it seems I can resize it only a finite amount with my mouse. $\endgroup$ Commented Jun 5, 2013 at 19:06
  • $\begingroup$ I was obliquely pointing out why you're seeing the crowdedness. Consider using tinier labels for your nodes. $\endgroup$ Commented Jun 5, 2013 at 19:12

2 Answers 2

1
$\begingroup$

You can adjust the image size using the option ImageSize->600 or ImageSize->800, whatever is needed. You might have missed this option when you look at the help for GraphPlot because it is listed indirectly: when you open up the Details section says: GraphPlot has the same options as Graphics, and under Graphics is where you find the ImageSize option.

$\endgroup$
1
  • $\begingroup$ Thanks. Just what I was looking for! $\endgroup$ Commented Jun 5, 2013 at 19:37
1
$\begingroup$

Use the Option ImageSize. If ImageSize->Large is not big enough, you can specify the magnification explicitly.

$\endgroup$

Your Answer

By clicking “Post Your Answer”, you agree to our terms of service and acknowledge you have read our privacy policy.

Not the answer you're looking for? Browse other questions tagged or ask your own question.