2
$\begingroup$

When Plotting (using the command Plot), AspectRatio->Automatic means :

enter image description here

The explanation of Automatic from mathematica help file, was not easy understand for me.

I want to explain it in other way :

If
the actual length from (0,0) to (1,0) in the plot is k pixels, then
the actual length from (0,0) to (0,1) in the plot is k pixels also.

Now the question : How can I set AspectRatio, so that

If
the actual length from (0,0) to (1,0) in the plot is k pixels, then
the actual length from (0,0) to (0,1) in the plot is 2k pixels ?

**I just got a message from a user, and I voted yes for the message since it was useful. Then my question was closed(I didn't expect that). The message was useful but I still do not know exactly how to achieve this.

Can anyone help me with a comment ?**

Note that AspectRatio->1/2 is not a correct answer.

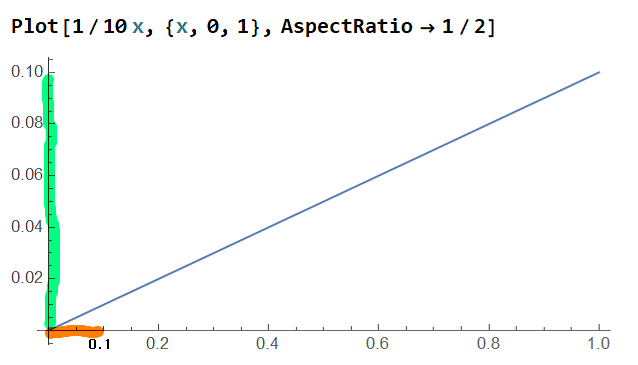
enter image description here

As you see in the above screenshot,
the length of (0,0) to (0, 0.1) is much much longer than
the length of (0,0) to (0.1, 0).
Not just twice longer.

+-+-+-+-+-+-+ After some comments and answers -+-+-+-+-+-+-+-+-+-+-+-+-+-+-+-+-

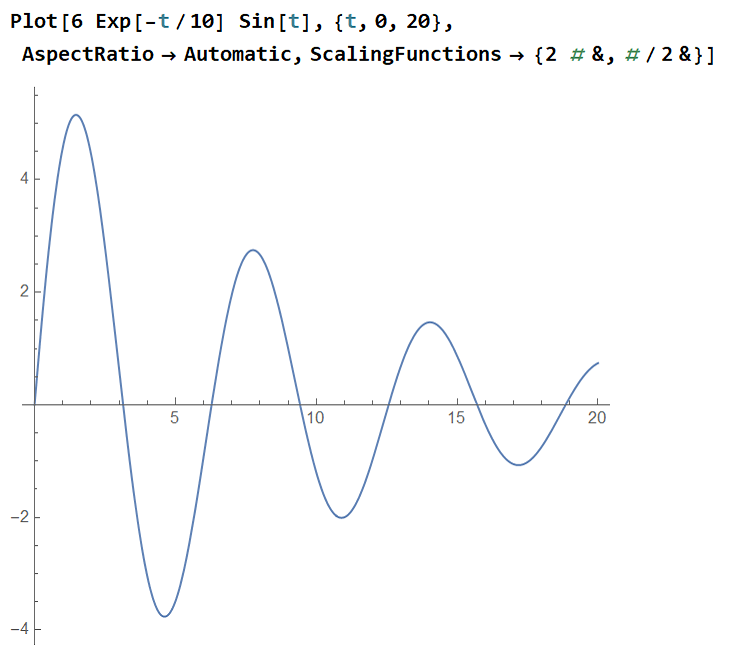
In my PC, @Michael E2's second solution (=following code) works fine. Below is a screenshot on my PC.

Plot[6 Exp[-t/10] Sin[t], {t, 0, 20}, AspectRatio -> Automatic, 
 ScalingFunctions -> {2 # &, #/2 &}]

enter image description here

@Michael E2's wrote that his second solution is not good because there is unwanted, strange logarithmic peak. But in my PC, there is no such logarithmic peak phenomenon. I am using mathematica V12.2.

$\endgroup$
11
  • 1
    $\begingroup$ Regarding your "on close" additional question. Such questions can be discussed on Meta, but this one is answered in Help. $\endgroup$ Commented Jul 10, 2022 at 14:58
  • $\begingroup$ Thank you, can you teach me again? $\endgroup$
    – imida k
    Commented Jul 10, 2022 at 15:00
  • $\begingroup$ What do you want to learn? $\endgroup$ Commented Jul 10, 2022 at 15:01
  • 1
    $\begingroup$ The wording of your question is not clear. The thread I linked to contains all the information you need to understand how AspectRatio works. $\endgroup$ Commented Jul 10, 2022 at 15:07
  • 2
    $\begingroup$ You need to make the plot, get the PlotRange, and then compute the AspectRatio to give the desired scaling. You can then impose the new aspect ratio with Show[]. You might be able to do it with ScalingFunctions like this: Plot[x, {x, 0, 10}, AspectRatio -> Automatic, ScalingFunctions -> {2 # &, #/2 &}] (but why does it produce logarithmically spaced ticks?) $\endgroup$
    – Michael E2
    Commented Jul 11, 2022 at 1:03

2 Answers 2

2
$\begingroup$

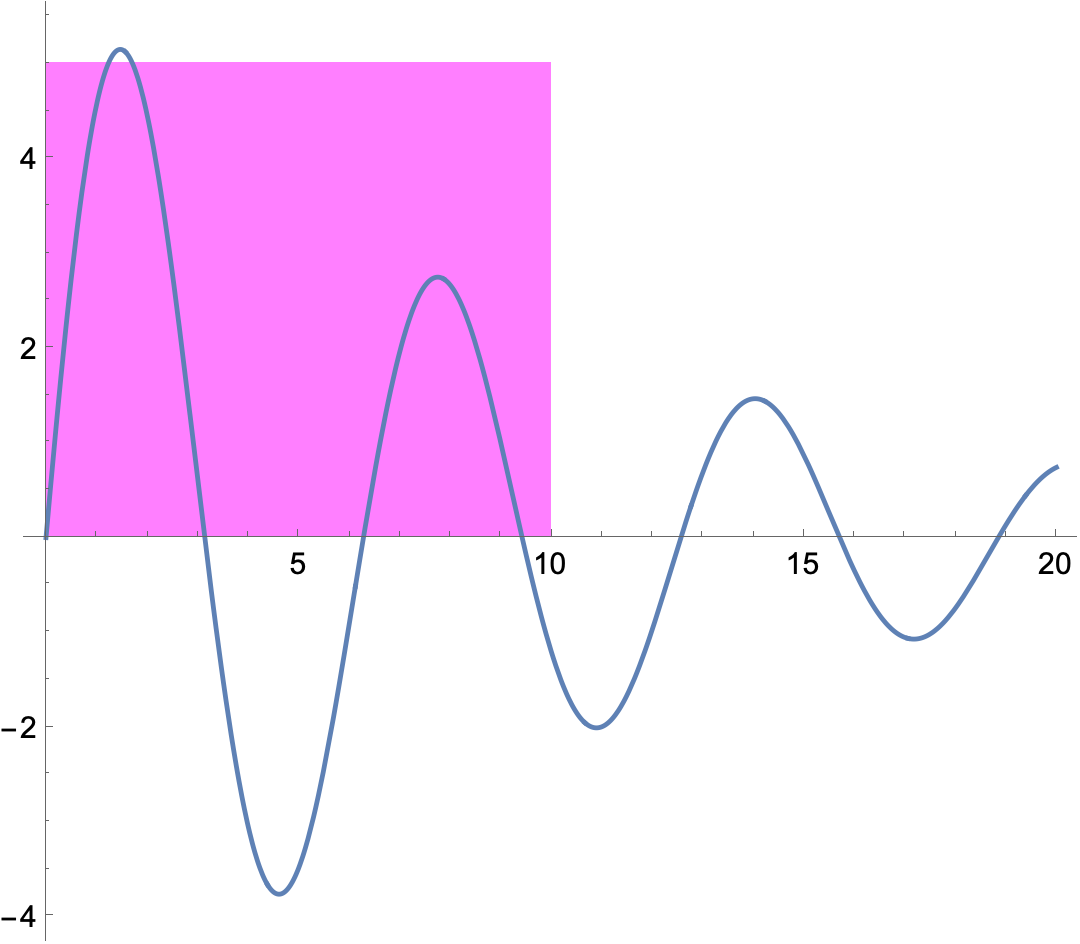
Make the plot, get the plot range, and then compute the aspect ratio to give the desired scaling. You can then impose the new aspect ratio with Show[]:

plot = Plot[6 Exp[-t/10] Sin[t], {t, 0, 20},
   Prolog ->(* to show aspect ratio is correct *)
    {Magenta, Opacity[0.5], Rectangle[{0, 0}, {10, 5}]}
   ];
aspRatio = 2 Ratios[Differences /@ PlotRange@plot][[1, 1]];
Show[plot, AspectRatio -> aspRatio]

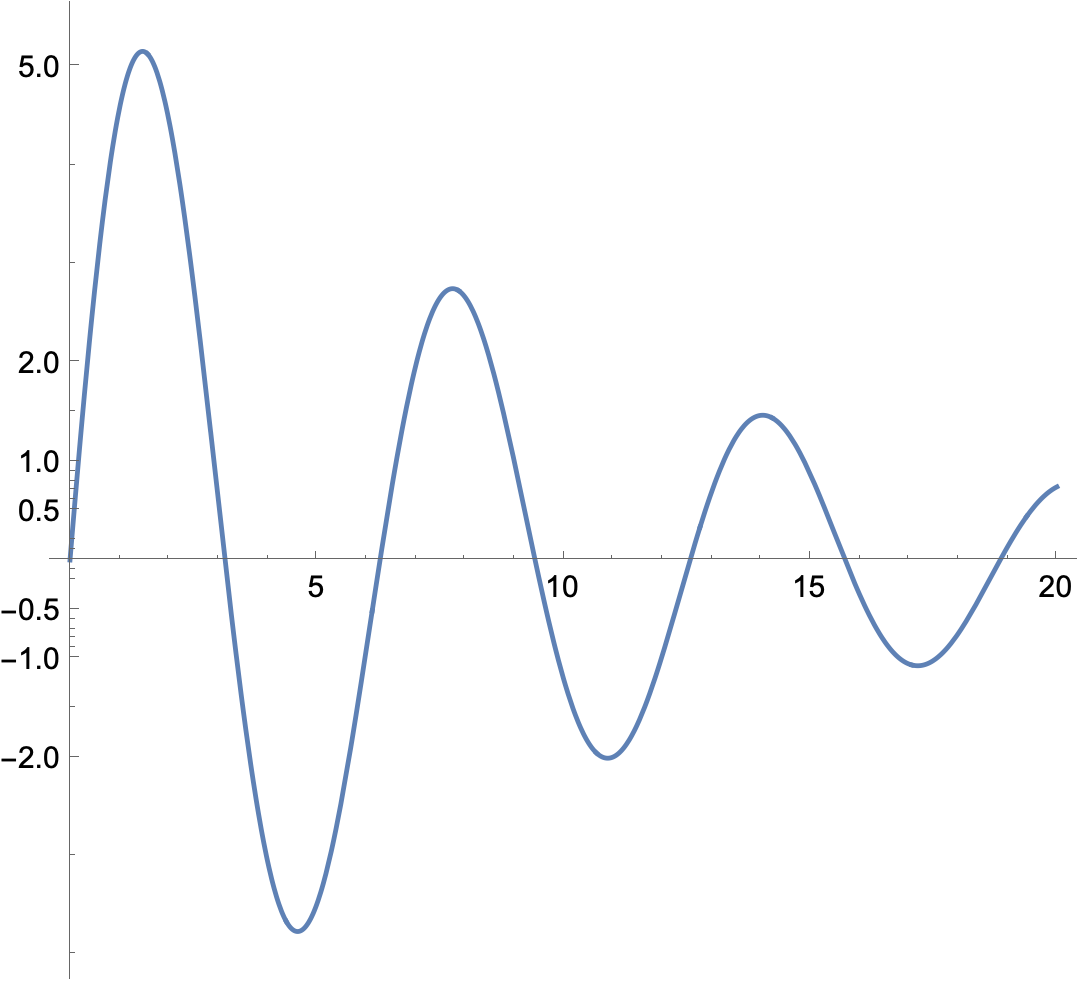
You might produce the desired plot with ScalingFunctions like the following (but why does it produce logarithmically spaced ticks?):

Plot[6 Exp[-t/10] Sin[t], {t, 0, 20},
 AspectRatio -> Automatic, ScalingFunctions -> {2 # &, #/2 &}
 ]

Note that the scaling functions messes up the coordinate system, so that if you include the Prolog from the first plot, it would need its coordinates scaled to match the plot (i.e., Rectangle[{0, 0}, {10, 10}]). I didn't feel it was worth showing this.

$\endgroup$
7
  • $\begingroup$ Thank you, but which mathematica version are you using ? I'm 12.2 and the code Plot[6 Exp[-t/10] Sin[t], {t, 0, 20}, AspectRatio -> Automatic, ScalingFunctions -> {2 # &, #/2 &}] works perfectly fine. There is no logarithmic peak on my PC. $\endgroup$
    – imida k
    Commented Jul 15, 2022 at 14:29
  • $\begingroup$ Michael was talking about the spacing of the ticks on the $y$-axis in the last picture, @imida. Can you take a screenshot of what you have? $\endgroup$ Commented Jul 15, 2022 at 14:37
  • $\begingroup$ Yes I uploaded a screenshot of my PC. Am I understanding correctly? $\endgroup$
    – imida k
    Commented Jul 15, 2022 at 14:40
  • 2
    $\begingroup$ @imidak Graph and the ticks are scaled and placed correctly, but the ticks shown are not regular. They (that is, 0.5, 1.0, 2.0, 5.0) are chosen as though the graph was supposed to be a log plot. $\endgroup$
    – Michael E2
    Commented Jul 15, 2022 at 14:46
  • 1
    $\begingroup$ Thank you again, so even in V13.1/Mac, mathematica is not wrong, but a little strange phenomemon is observed(irregular ticks) $\endgroup$
    – imida k
    Commented Jul 15, 2022 at 14:56
3
$\begingroup$

Here is a function which sets up the unit aspect ratio for a plot:

setUnitAspectRatio[unitAspectRatio_ : 1/2][plot_Graphics] := Module[{xmin, xmax, ymin, ymax},
  {{xmin, xmax}, {ymin, ymax}} = 
   "PlotRange" /. ResourceFunction["GraphicsInformation"][plot];
  Show[plot, AspectRatio -> unitAspectRatio (ymax - ymin)/(xmax - xmin)]]

It can be used as follows.

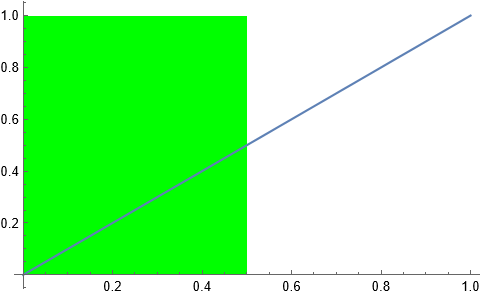
Suppose we have a plot (the prolog shows a rectange with width 1/2 and height 1 in the units of the internal coordinate system of Graphics):

plot = Plot[x, {x, 0, 1}, Prolog -> {Green, Rectangle[{0, 0}, {1/2., 1}]}]

output

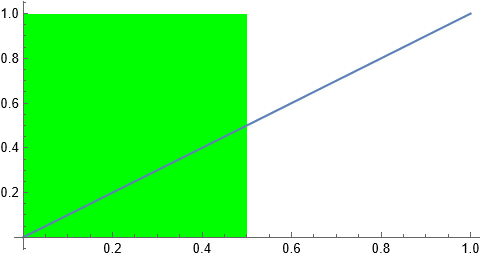
To set it up in such a way that this rectangle will become a square on the canvas (i.e., in pixels), we proceed as follows:

newplot = setUnitAspectRatio[1/2]@plot

output

Checking the pixel size of the rectangle:

ImageDimensions@ImageCrop[Show[newplot, Axes -> False] /. _Line :> (## &[])]
{230, 231}

It is a square accurately to one pixel, as expected.

$\endgroup$

Your Answer

By clicking “Post Your Answer”, you agree to our terms of service and acknowledge you have read our privacy policy.

Not the answer you're looking for? Browse other questions tagged or ask your own question.