added 10 characters in body
Source Link
Alexey Popkov
  • 62.3k
  • 7
  • 154
  • 375

Here is a function which sets up the unit aspect ratio for a plot:

setUnitAspectRatio[unitAspectRatio_ : 1/2][plot_Graphics] := Module[{xmin, xmax, ymin, ymax},
  {{xmin, xmax}, {ymin, ymax}} = 
   "PlotRange" /. ResourceFunction["GraphicsInformation"][plot];
  Show[plot, AspectRatio -> unitAspectRatio (ymax - ymin)/(xmax - xmin)]]

It can be used as follows.

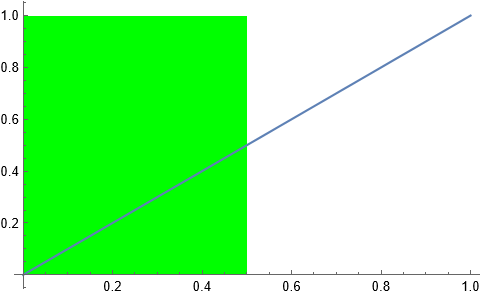
Suppose we have a plot (the prolog shows a rectange with width 1/2 and height 1 in the units of the internal coordinate system of Graphics):

plot = Plot[x, {x, 0, 1}, Prolog -> {Green, Rectangle[{0, 0}, {1/2., 1}]}]

output

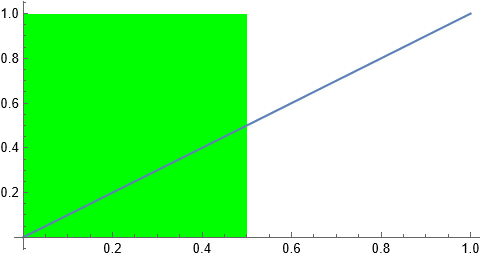
To set it up in such a way that this rectangle will become a square on the canvas (i.e., in pixels), we proceed as follows:

newplot = setUnitAspectRatio[1/2]@plot

output

Checking the pixel size of the rectangle:

ImageDimensions@ImageCrop[Show[newplot, Axes -> False] /. _Line :> (## &[])]
{230, 231}

It is a square accurately to one pixel, as expected.

Here is a function which sets up the unit aspect ratio for a plot:

setUnitAspectRatio[unitAspectRatio_ : 1/2][plot_Graphics] := Module[{xmin, xmax, ymin, ymax},
  {{xmin, xmax}, {ymin, ymax}} = 
   "PlotRange" /. ResourceFunction["GraphicsInformation"][plot];
  Show[plot, AspectRatio -> unitAspectRatio (ymax - ymin)/(xmax - xmin)]]

It can be used as follows.

Suppose we have a plot (the prolog shows a rectange with width 1/2 and height 1 in the units of the internal coordinate system of Graphics):

plot = Plot[x, {x, 0, 1}, Prolog -> {Green, Rectangle[{0, 0}, {1/2., 1}]}]

output

To set it up in such a way that this rectangle will become a square on the canvas (i.e., in pixels), we proceed as follows:

setUnitAspectRatio[1/2]@plot

output

Checking the pixel size of the rectangle:

ImageDimensions@ImageCrop[Show[newplot, Axes -> False] /. _Line :> (## &[])]
{230, 231}

It is a square accurately to one pixel, as expected.
Here is a function which sets up the unit aspect ratio for a plot:

setUnitAspectRatio[unitAspectRatio_ : 1/2][plot_Graphics] := Module[{xmin, xmax, ymin, ymax},
  {{xmin, xmax}, {ymin, ymax}} = 
   "PlotRange" /. ResourceFunction["GraphicsInformation"][plot];
  Show[plot, AspectRatio -> unitAspectRatio (ymax - ymin)/(xmax - xmin)]]

It can be used as follows.

Suppose we have a plot (the prolog shows a rectange with width 1/2 and height 1 in the units of the internal coordinate system of Graphics):

plot = Plot[x, {x, 0, 1}, Prolog -> {Green, Rectangle[{0, 0}, {1/2., 1}]}]

output

To set it up in such a way that this rectangle will become a square on the canvas (i.e., in pixels), we proceed as follows:

newplot = setUnitAspectRatio[1/2]@plot

output

Checking the pixel size of the rectangle:

ImageDimensions@ImageCrop[Show[newplot, Axes -> False] /. _Line :> (## &[])]
{230, 231}

It is a square accurately to one pixel, as expected.
Source Link
Alexey Popkov
  • 62.3k
  • 7
  • 154
  • 375

Here is a function which sets up the unit aspect ratio for a plot:

setUnitAspectRatio[unitAspectRatio_ : 1/2][plot_Graphics] := Module[{xmin, xmax, ymin, ymax},
  {{xmin, xmax}, {ymin, ymax}} = 
   "PlotRange" /. ResourceFunction["GraphicsInformation"][plot];
  Show[plot, AspectRatio -> unitAspectRatio (ymax - ymin)/(xmax - xmin)]]

It can be used as follows.

Suppose we have a plot (the prolog shows a rectange with width 1/2 and height 1 in the units of the internal coordinate system of Graphics):

plot = Plot[x, {x, 0, 1}, Prolog -> {Green, Rectangle[{0, 0}, {1/2., 1}]}]

output

To set it up in such a way that this rectangle will become a square on the canvas (i.e., in pixels), we proceed as follows:

setUnitAspectRatio[1/2]@plot

output

Checking the pixel size of the rectangle:

ImageDimensions@ImageCrop[Show[newplot, Axes -> False] /. _Line :> (## &[])]
{230, 231}

It is a square accurately to one pixel, as expected.