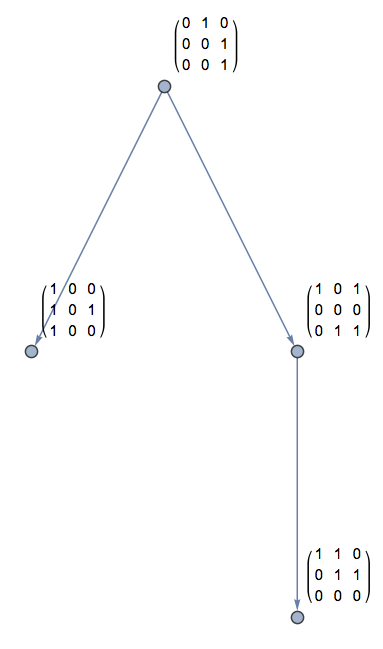
It looks to me like you're using DirectedEdges, which are designed to work with Graph as opposed to GraphPlot. If you'd like to use GraphPlot and VertexRenderingFunction, you can do like so:
matrix[1] = {
   {0, 1, 0},
   {0, 0, 1},
   {0, 0, 1}
   };
matrix[2] = {
   {1, 0, 0},
   {1, 0, 1},
   {1, 0, 0}
   };
matrix[3] = {
   {1, 0, 1},
   {0, 0, 0},
   {0, 1, 1}
   };
matrix[4] = {
   {1, 1, 0},
   {0, 1, 1},
   {0, 0, 0}
   };
vertexRenderer[position_, v_] :=
  {Text[Framed[matrix[v], Background -> RGBColor[1, 1, 0.8],
     FrameStyle -> RGBColor[0.94, 0.85, 0.36]], position]};
GraphPlot[{1 -> 2, 1 -> 3, 3 -> 4},
 DirectedEdges -> True,
 VertexRenderingFunction -> vertexRenderer]

You might seriously consider using the newer (and generally better) Graph based functionality and leverage the fact that virtually anything can be a vertex - including your matrices. Then, labeling the vertices is as simple as using VertexLabels.
Graph[{matrix[1] -> matrix[2], matrix[1] -> matrix[3], matrix[3] -> matrix[4]},
  VertexLabels -> "Name", PlotRangePadding -> {{0.01, 0.2}, {0.01, 0.2}}]

If desired, you can always use VertexShapeFunction to get more control over the appearance.


