Problem
I have a very large graph of 65,536 vertices. GraphPlot yields:
But the vertices are too dense to see in any detail, and attempting to use any of the on-the-fly image options leads to Mathematica hanging.
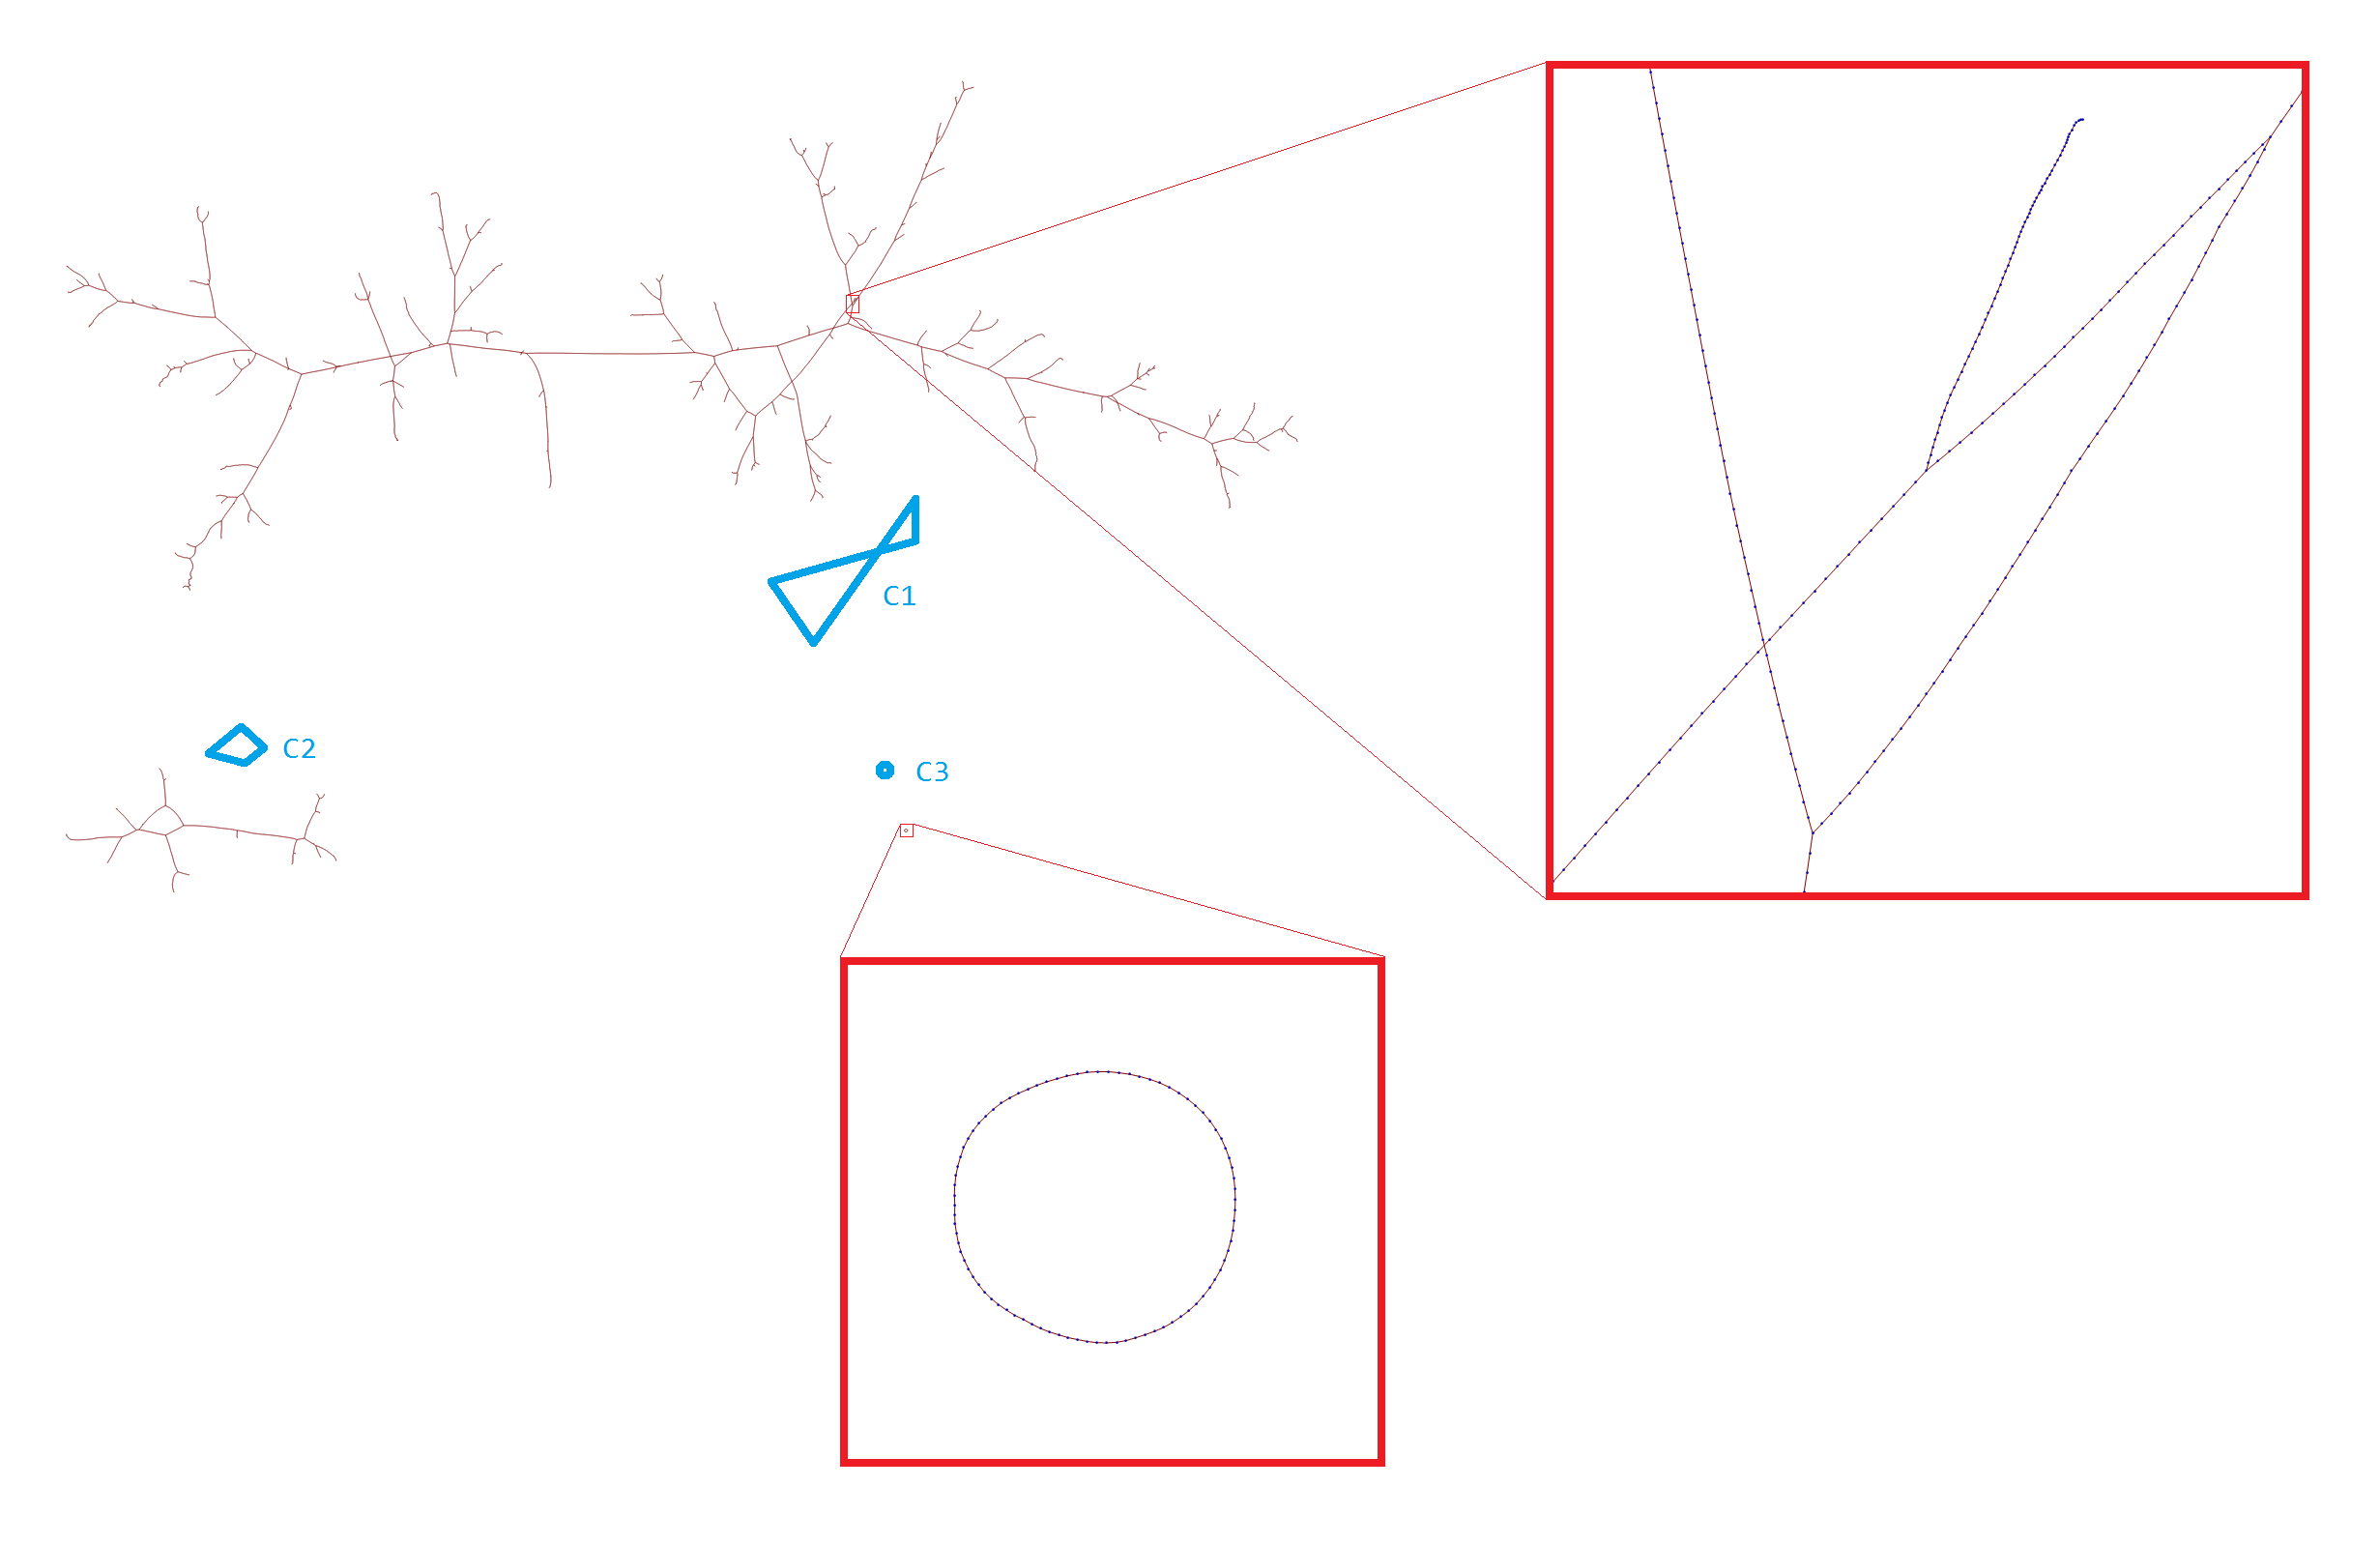
First, I decided to try removing all vertex graphics (leaving only edges), to "thin" the graph. While trying different things, I improperly set VertexStyle->None. This threw a load of errors (probably 65,536 of them), but achieved the effect I desired, so I took a screenshot, which you can see below.
To get those zoomed views, I had to set ImageSize->{192000,108000}—a hundred times my screen resolution—and take screenshots at the regions, as exporting was not possible (more on this below). To give a sense of how unwieldy the size of this image was, it took me 10 minutes to find the cycle labeled C3; I ended up taking a screenshot of the overall view, drawing a horizontal line from C3 to C2, and using this latitudinal reference to start at C2 and scroll horizontally until I hit C3.
Furthermore, attempting to export this image via
Export["output.jpg", %29, "JPEG"]
resulted in
Rasterize::bigraster: Not enough memory available to rasterize Graphics expression. >>
for JPG, GIF, BMP, and PNG. (I did try restarting Mathematica to clear some memory, as another post suggested.)
It did export as an SVG, and Chrome and Internet Explorer was able to render the zoomed-out view, but would hang or crash upon attempting to zoom in.
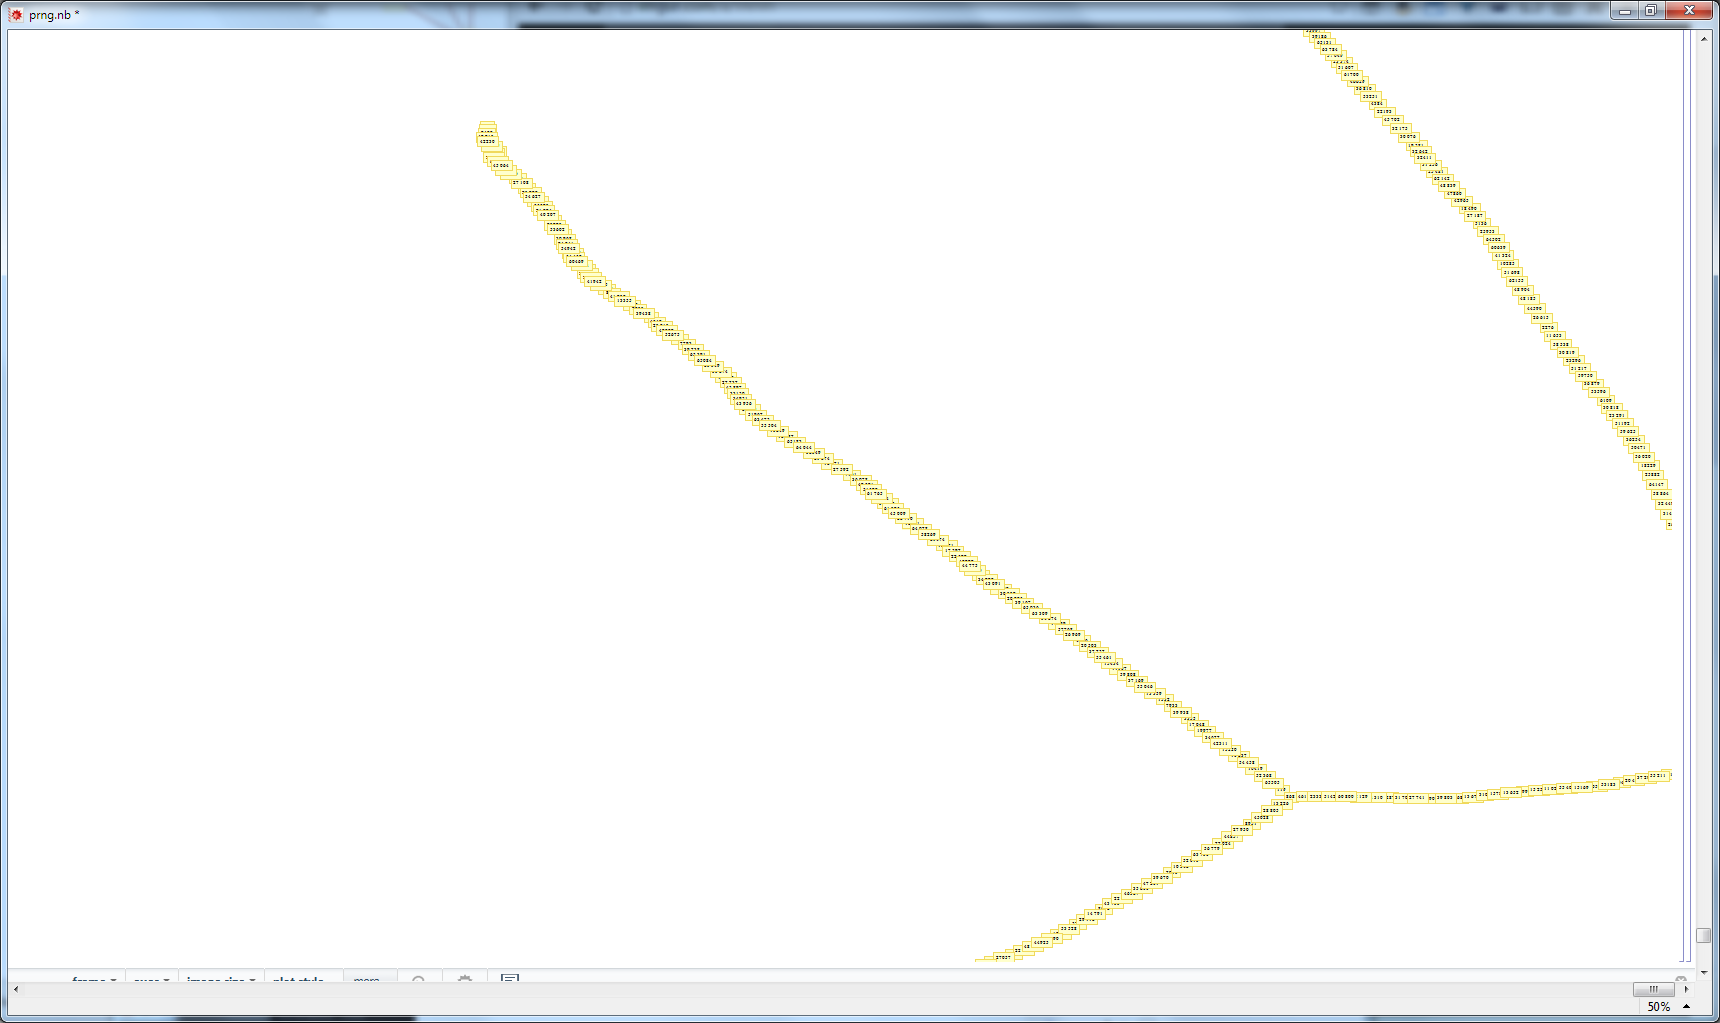
I thought, "Well, all this is an independent issue I'll have to solve eventually. But meanwhile, I also need to add vertex labels." So, I went ahead and enabled VertexLabeling->True. As you can anticipate, the labels were all atop one another, even at 200 times my screen resolution, ImageSize->{384000,216000}:
I'm not sure if it's the introduction of VertexLabeling or the sheer size of the image (or both), but the image was also wrapped in a
A very large output was generated. Here is a sample of it:
box, which didn't appear before. And the image was so gigantic, that it appeared to have "disappeared" into the right and bottom borders of the cell, such that the familiar Show more... button was not even accessible, as odd as that might seem.
Question
How can I render and / or manipulate this graph so that I can have a fully detailed, exported view (BMP, JPG, GIF, PNG), including vertex labels, that anyone can open, pan, and zoom?
I'm actively experimenting, but having to wait 45-60 seconds for each trial to finish makes the process very painful. Not all vertices actually need to be labeled, if in the end, I can use VertexLabeling->TrueQ to label just some important nodes, and there's a way to display a summary label, e.g. 347 nodes, for a count of unimportant nodes between important ones. (But that's an entirely separate challenge to tackle.) In the worst case, I'm thinking I'll have to manually segment the graph into several pieces, i.e. programmatically obtain, say, all vertices in the left half of the C1 structure, and have several plots. However, this would be extremely inconvenient, as later on I'll want to inject "special" edges that connect the separate "islands."
Is there some other way to draw or export this graph I may not know? Whether it be altering drawing rules, altering node or label graphics, or employing some segment-by-segment rendering technique.
Code & Background
In case it's helpful to replicate the issues I'm having, here's the (surprisingly concise) code:
  Hex[exp_] := FromDigits[exp, 16];
  LByte[exp_] := BitAnd[exp, Hex@"00ff"];
  HByte[exp_] := BitAnd[exp, Hex@"ff00"]~BitShiftRight~8;
  PRNG[v_] := Module[{L5, H5, v1, v2, carry},
    L5 = LByte@v*5;
    H5 = HByte@v*5;
    v1 = LByte@H5 + HByte@L5 + 1;
    carry = HByte@v1~BitGet~0;
    v2 = BitShiftLeft[LByte@v1, 8] + LByte@L5;
    Mod[v2 + Hex@"0011" + carry, Hex@"ffff" + 1]
    ];
  mappings = # -> PRNG@# & /@ Range[0, Hex@"ffff"];
  GraphPlot[mappings]
To give some background, I'm studying the geometry of a 16-bit pseudo-random number generator, i.e. a function that maps a number $[0..65535]$ to another number $[0..65535]$. The code above almost matches a simple LCG (linear congruential generator) by the formula $$f(x)=5x+273\mod{65536}$$ except the pesky carry bit sometimes makes it $274$ (for 766 cases, to be precise).
Also, I'm running Mathematica 9.0.1.0. If there were a solution available only in version 10, I would strongly consider an upgrade.
EDIT: I've also run the above on Mathematica 10.4, unfortunately with the same results.


