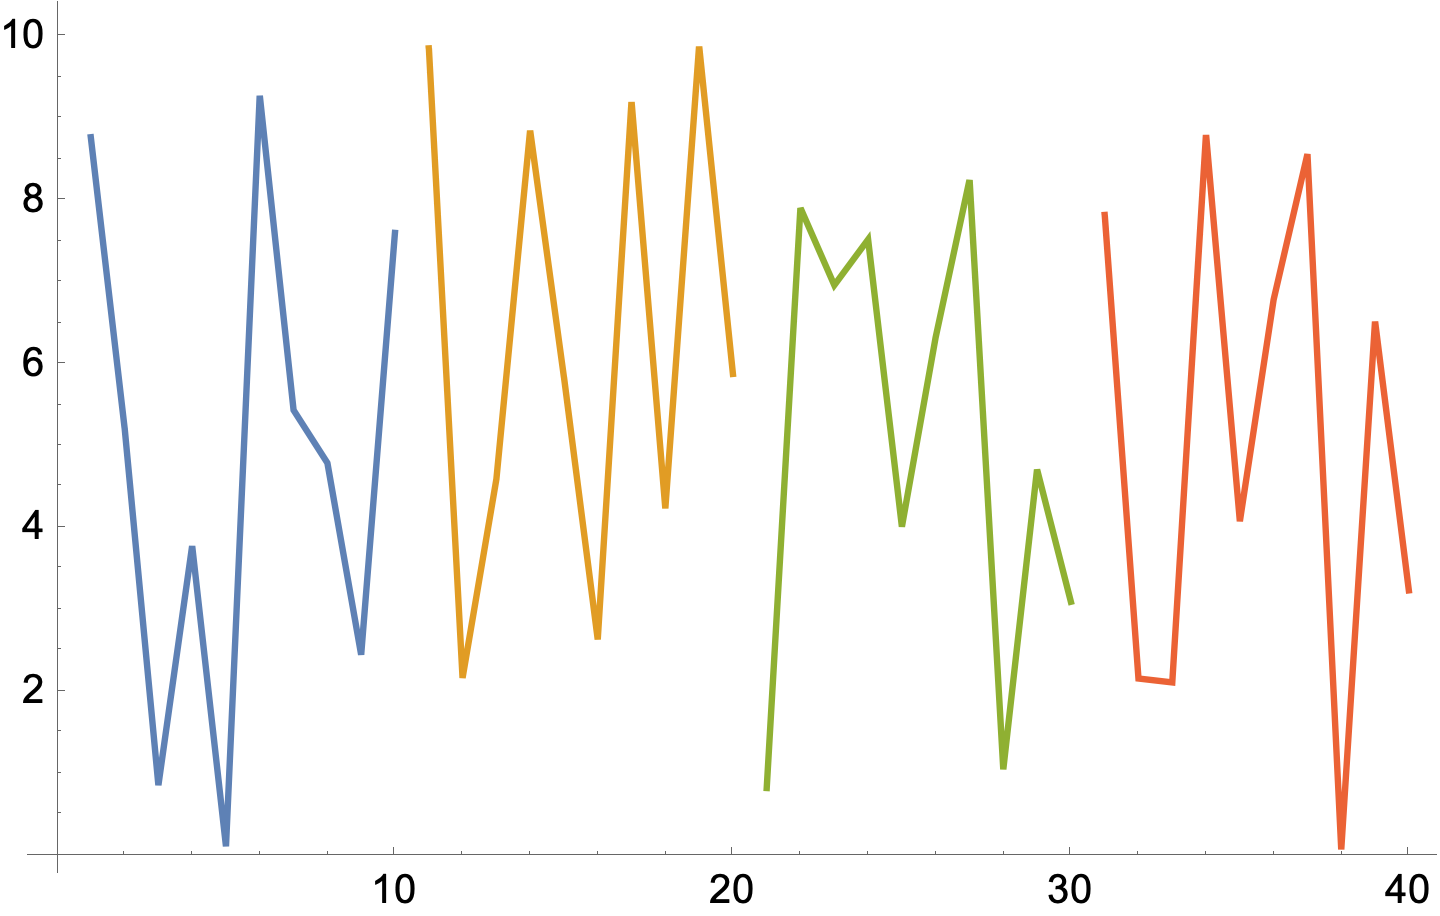
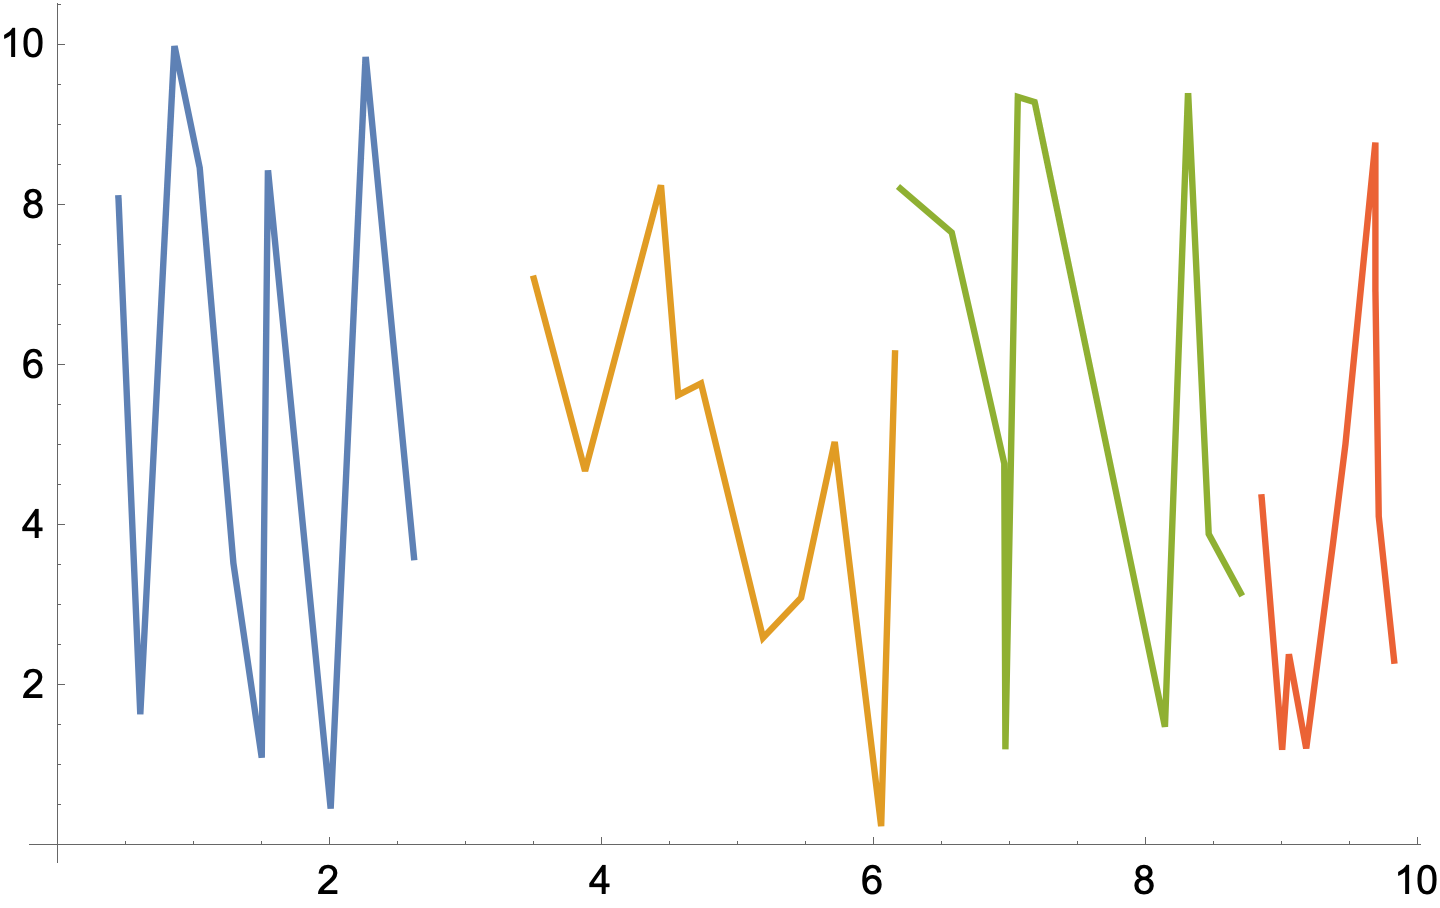
I have an array of data, I am trying to plot it but I need to draw a line each 10 data and displayed as a discontinuous function.
I tried using ListLinePlot but this joins all the data, not in intervals of 10 as I want it. The array has a large amount of data.
Could you help me please?


