0
$\begingroup$

I have an array of data, I am trying to plot it but I need to draw a line each 10 data and displayed as a discontinuous function. I tried using ListLinePlot but this joins all the data, not in intervals of 10 as I want it. The array has a large amount of data.

Could you help me please?

$\endgroup$
1
  • 1
    $\begingroup$ Please include the code you tried and the problem you encountered so that readers can reproduce and solve your problem. $\endgroup$
    – bbgodfrey
    Commented Nov 17, 2021 at 14:12

1 Answer 1

6
$\begingroup$
Clear["Global`*"]

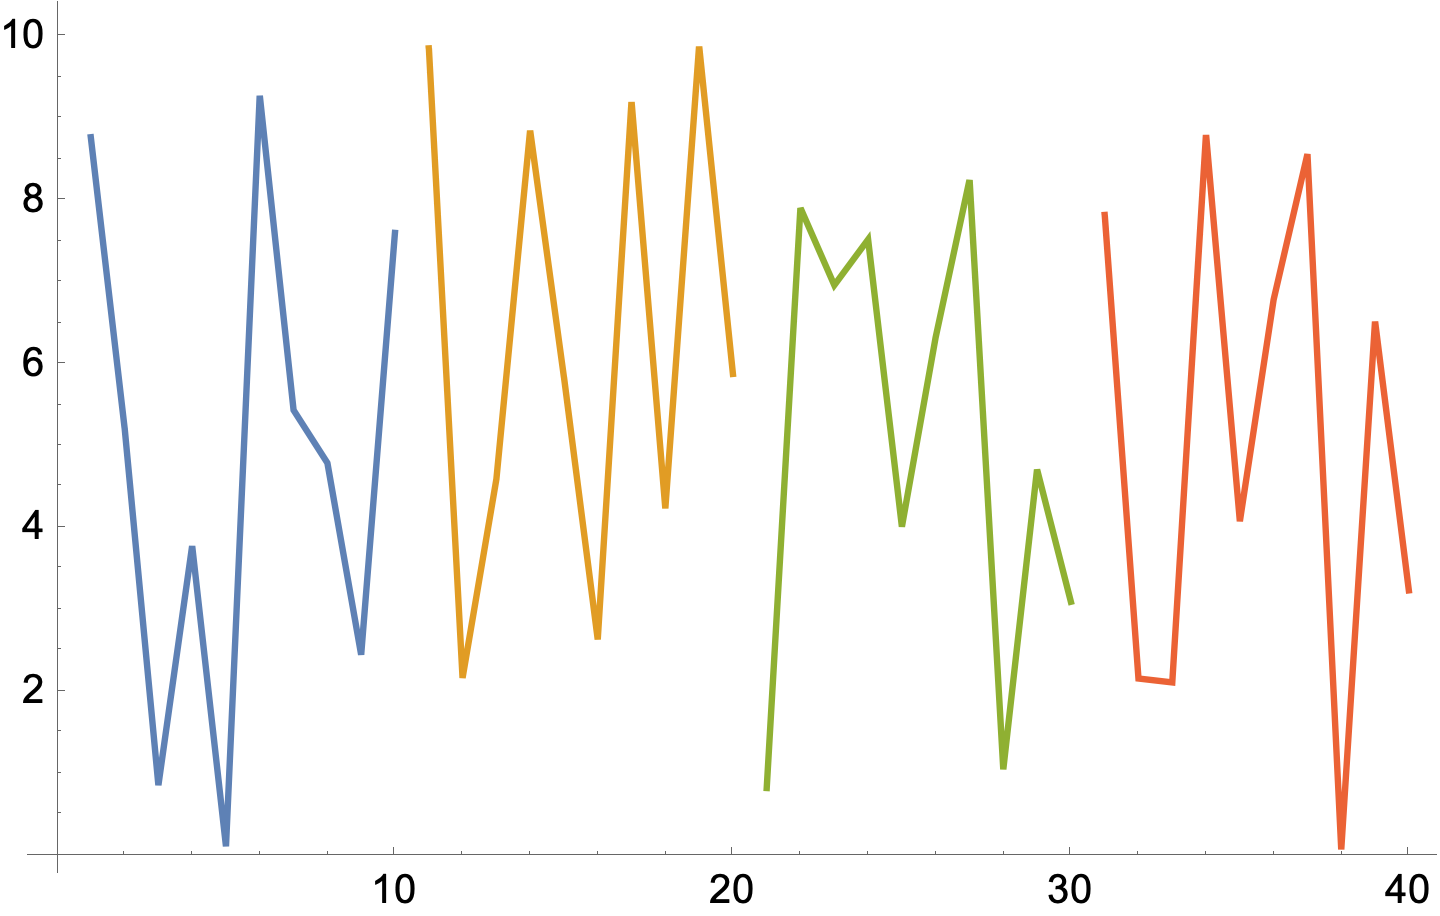
Partition the data

SeedRandom[1234];

data = RandomReal[10, 40];

ListLinePlot@Partition[Transpose[{Range[Length[data]], data}], 10]

enter image description here

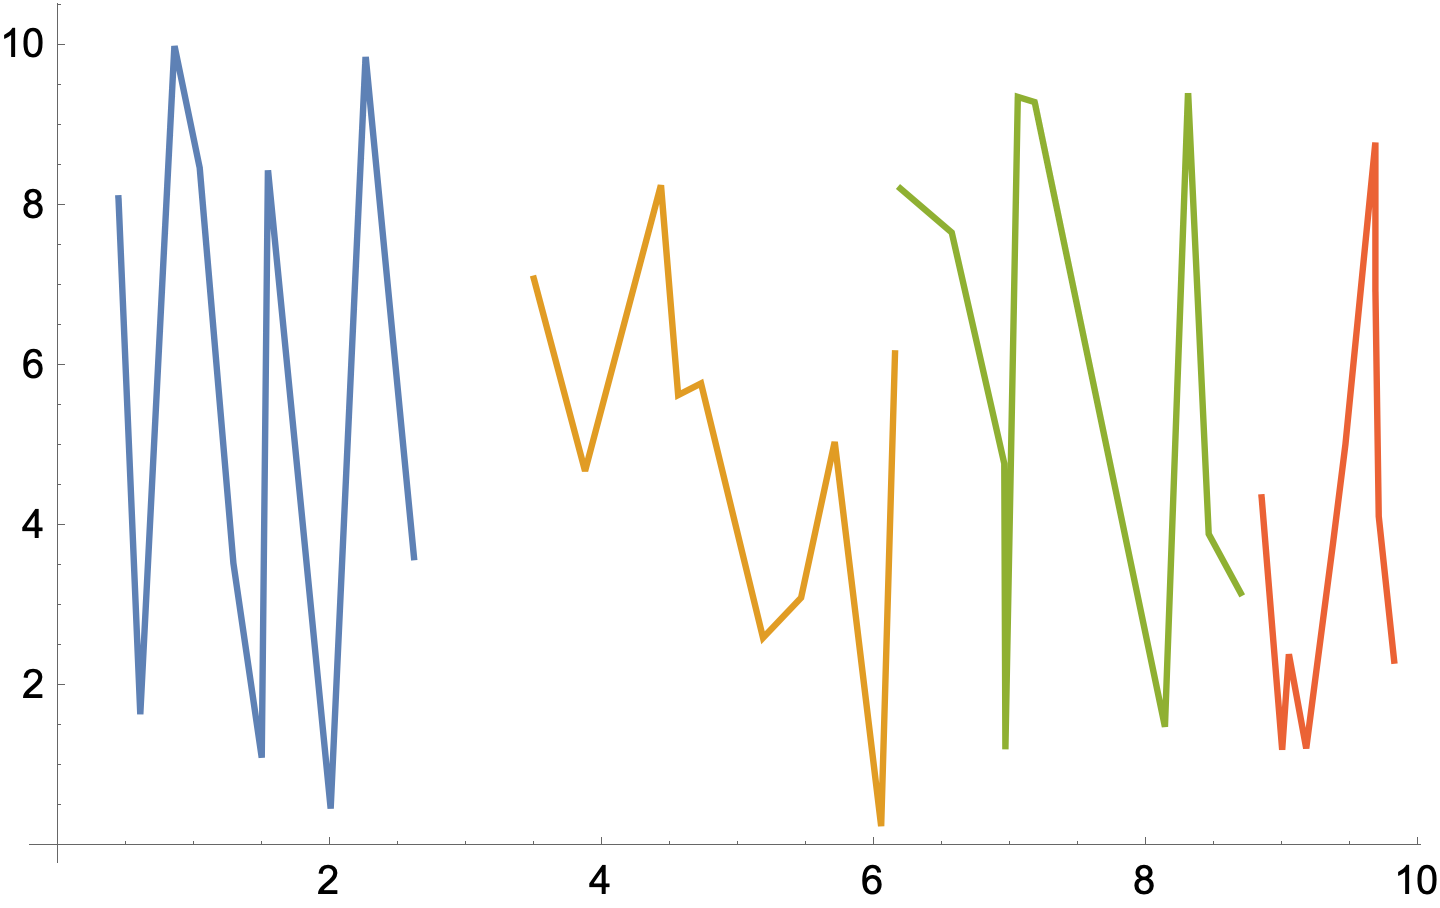
data2 = Sort@RandomReal[10, {40, 2}];

ListLinePlot@Partition[data2, 10]

enter image description here

$\endgroup$

Your Answer

By clicking “Post Your Answer”, you agree to our terms of service and acknowledge you have read our privacy policy.

Not the answer you're looking for? Browse other questions tagged or ask your own question.