2
$\begingroup$

I have a data set absolute time data {absolute time, species} set that looks like this

mydata = {{3558297660,74}, {3558297720,38}, {3558297780,61},
  {3558297900,26}, {3558297960,100}, {3558298020,50}, {3558298080,70}, 
  {3558298140,90}, {3558298260, 29}, {3558298320,65}, {3558298380,24}, 
  {3558298500,67},{3558298560,80}, {3558298740,16}, {3558298800,68}};

Each time step is 60 s apart, I'm trying to create a continuous data array spaced 60 s apart with missing time entries replaced by the right time and "NA" as below

newdata = {{3558297660,74}, {3558297720,38}, {3558297780,61},
  {3558297840,"NA"}, {3558297900,26}, {3558297960,100}, {3558298020,50}, 
  {3558298080,70}, {3558298140,90}, {3558298200,"NA"}, {3558298260,29}, 
  {3558298320,65}, {3558298380,24}, {3558298440,"NA"}, {3558298500,67}, 
  {3558298560,80}, {3558298620,"NA"}, {3558298680,"NA"}, {3558298740,16},
  {3558298800,68}};

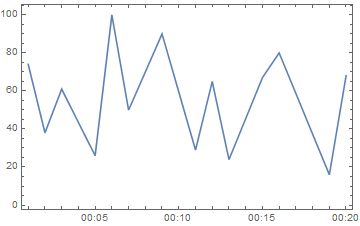
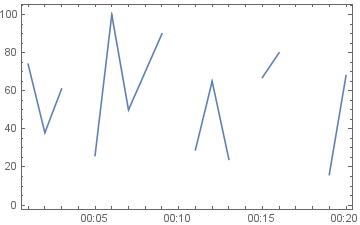
The main reason why I have sought help of the community is that I intend to use the DateListPlot function to plot a TemporalData using the Joined option which is annoying when there are gaps in the data (as it joins this point, making the plot a bit messy). I have adapted your code for what I want and was wondering if there are options in DateListPlot to handle this. I will to plot the data using the joined option but skipping any large time gap or as replacing them with "NA"/Missing["NA"]

$\endgroup$
1
  • $\begingroup$ I would suggest using Missing["NA"] instead, as that's the format easily handled by Mathematica. $\endgroup$ Commented Aug 22, 2017 at 16:23

4 Answers 4

6
$\begingroup$

An alternative to Alexey Golyshev's answer that is more functional programming oriented:

data = <|Rule @@@ mydata|>;
{#, Lookup[data, #, Missing["NA"]]} & /@ 
 Range[Sequence @@ MinMax[mydata[[All, 1]]], 60]

The idea is to create a lookup table from your data and to create a new list using which is filled using Lookup.

$\endgroup$
2
  • 1
    $\begingroup$ Cool! Short and elegant code. +1 $\endgroup$ Commented Aug 22, 2017 at 18:01
  • $\begingroup$ Thanks @Mathe172. Really helpful $\endgroup$
    – L Pola
    Commented Aug 24, 2017 at 10:51
3
$\begingroup$
ts = TimeSeriesResample[mydata, 60, ResamplingMethod -> {"Constant", "NA"} ]; 

ts == newdata

True

DateListPlot[ts]

enter image description here

$\endgroup$
1
$\begingroup$
newdata = Reap[
   Sow[mydata[[1]]];
   Do[
    diff = mydata[[i + 1, 1]] - mydata[[i, 1]];
    If[diff > 60,
     Sow /@ Table[{mydata[[i, 1]] + 60*j, Missing["NA"]}, {j, Quotient[diff, 60] - 1}]
     ];
    Sow[mydata[[i + 1]]]
    ,
    {i, 1, Length@mydata - 1}
    ]
   ][[2, 1]]

DateListPlot[
 TimeSeries[newdata, MissingDataMethod -> {"Interpolation", InterpolationOrder -> 1}]
 ]

enter image description here

$\endgroup$
3
  • 1
    $\begingroup$ Thanks @Alexey, managed to get it to work. The main reason why I have sought help of the community is that I intend to use the DateListPlot function to plot a temporal data using the Joined option which is annoying when there are gaps in the data (as it joins this point, making the plot a bit messy). I have adapted your code for what I want and was wondering if there are options in DateListPlot to handle this. $\endgroup$
    – L Pola
    Commented Aug 24, 2017 at 10:51
  • $\begingroup$ @LPola See updated answer. $\endgroup$ Commented Aug 24, 2017 at 14:20
  • $\begingroup$ I got the previous code to work for what I intended. I want to join the continuous point in my data and leave the gaps without interpolating. My amended question was just to check if there's a simpler way to do this using the DateListPlot. But thanks once again for helping. $\endgroup$
    – L Pola
    Commented Aug 25, 2017 at 9:34
1
$\begingroup$

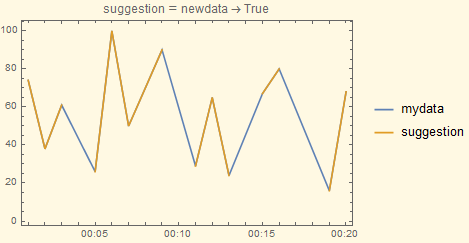
This a solution using the option ResamplingMethod for TimeSeries along with the TimeSeriesResample built-in:

Block[{ts, tsopts, ts2, correctQ},
 With[{tspec = {"Year", "/", "Month", "/", "Day", ", ", "Hour", ":", "Minute", ":", "Second", ".", "Millisecond"}},
   tsopts = Sequence[
     ResamplingMethod -> Missing["NotAvailable"],
     DateFunction -> (DateString[#, tspec] &)
    ];

   ts = Apply[TimeSeries[#2, {#1}, Evaluate[tsopts]] &][Transpose[mydata]];
   ts2 = TimeSeriesResample[ts, Thread[ts[{"FirstTime", "LastTime"}]]];
   correctQ = ts2["Path"] == (newdata /. "NA" -> Missing["NotAvailable"]);

   DateListPlot[
     {ts, ts2},
     PlotLabel -> suggestion == HoldForm[newdata] -> correctQ,
     PlotLegends -> {HoldForm[mydata], suggestion}
    ]
  ]
 ]

enter image description here

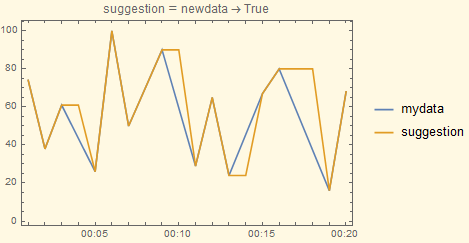
Alternatively, modifying tsopts above like in

tsopts = Sequence[
  ResamplingMethod -> {"Interpolation", InterpolationOrder -> 0},
  DateFunction -> (DateString[#, tspec] &)
];

and replacing everything between the lines starting with ts2=... and finishing before DateListPlot, with

(* check for same dimensions *)
correctQ0 = SameQ @@ (Dimensions /@ {ts2["Path"], newdata});
If[
  correctQ0,
  {correctQ1, correctQ2} = Through[{
    (* same timestamps and values for cases other than NA *)
    And @@ Cases[#, {{t1_, v1_}, {t2_, v2_}} :> True /; t1 == t2 && v1 == v2 && v2 =!= "NA"] &,
    (* same timestamps for cases with NA's *)
    And @@ Cases[#, {{t1_, v1_}, {t2_, v2_}} :> True /; t1 == t2 && v2 =!= "NA"] &
   }[Transpose[{ts2["Path"], newdata}]]],
  correctQ1 = correctQ2 = False
];

correctQ = And @@ {correctQ0, correctQ1, correctQ2};

produces the following result:

Blockquote

$\endgroup$

Your Answer

By clicking “Post Your Answer”, you agree to our terms of service and acknowledge you have read our privacy policy.

Not the answer you're looking for? Browse other questions tagged or ask your own question.