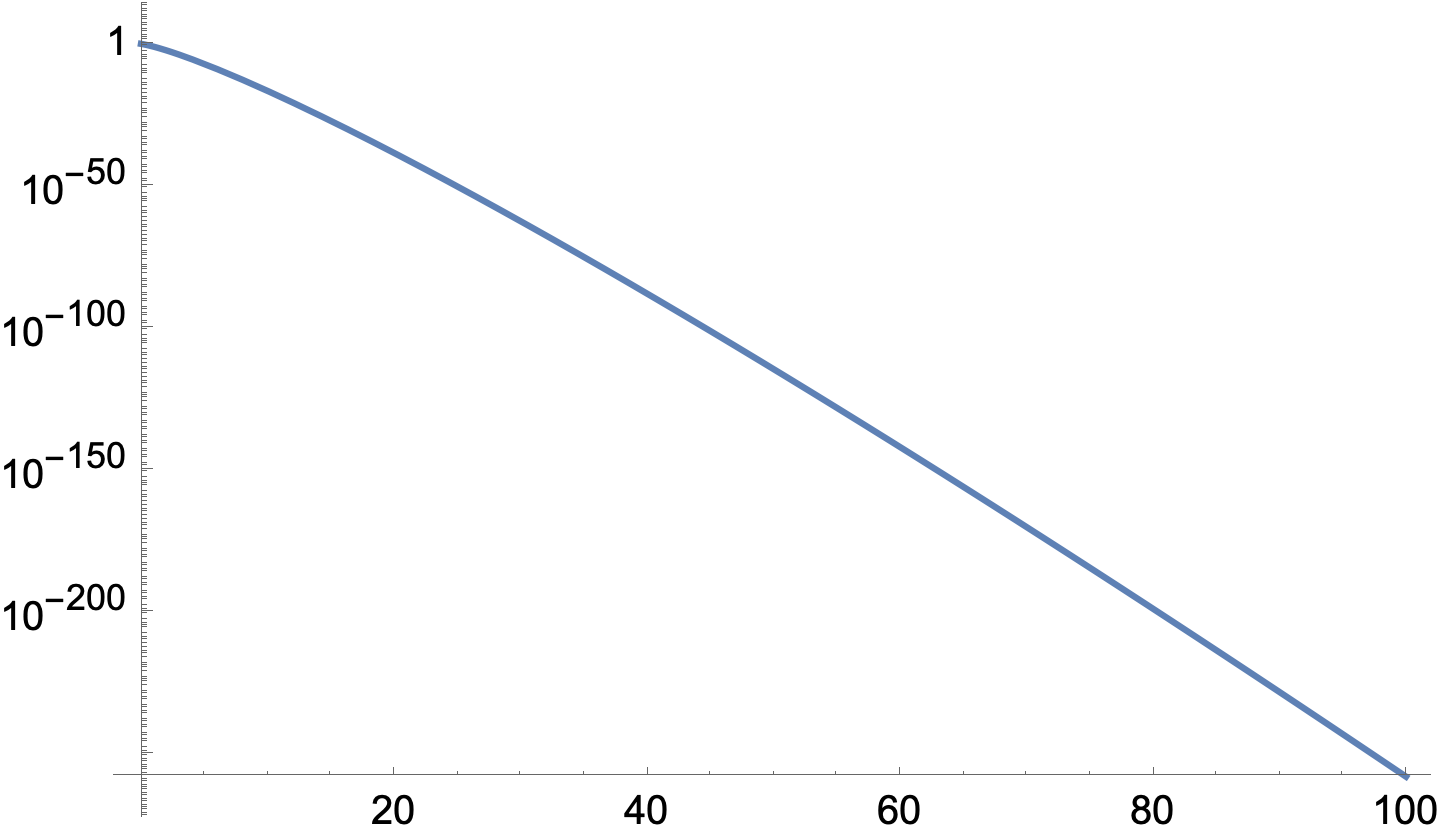
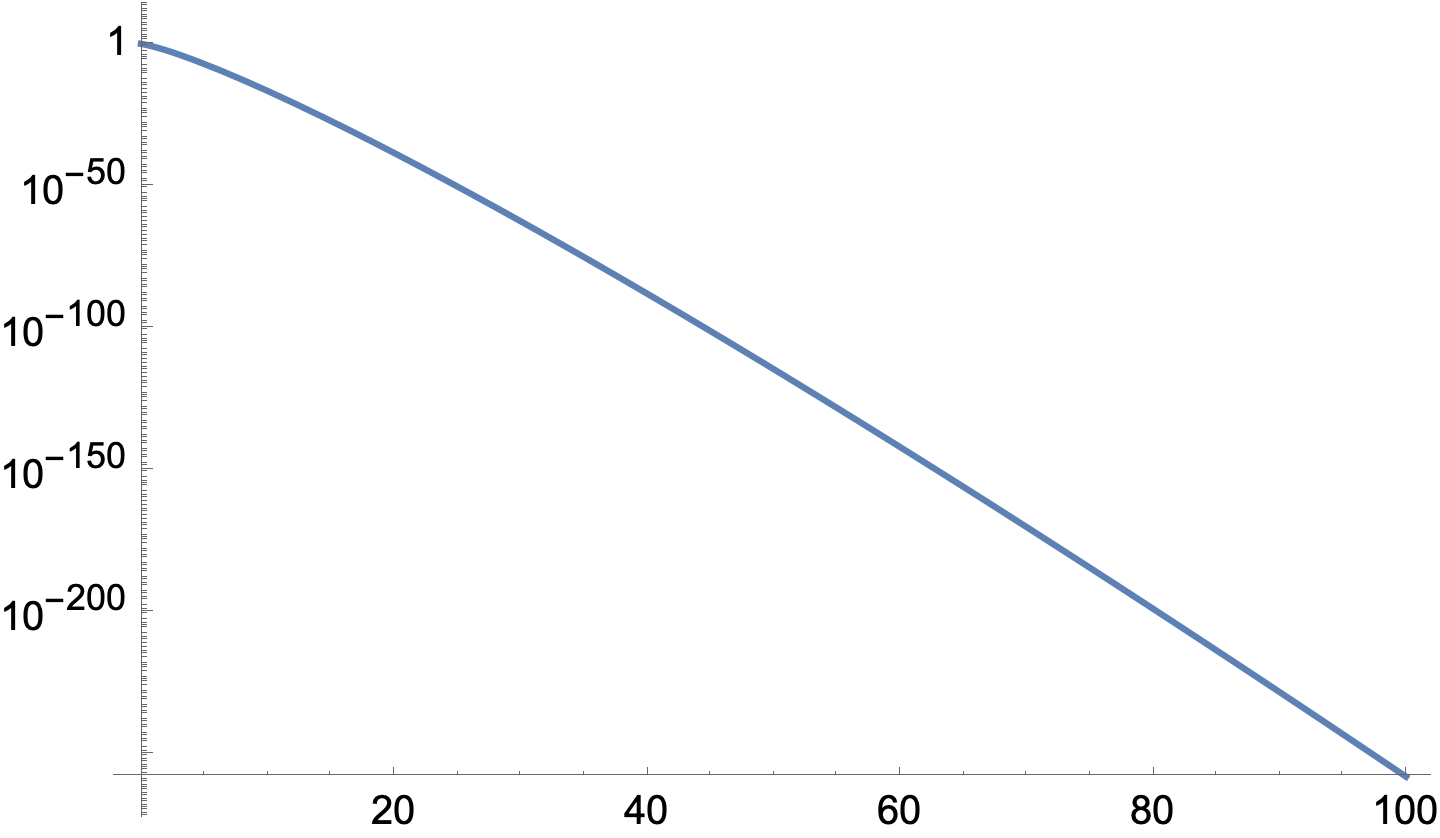
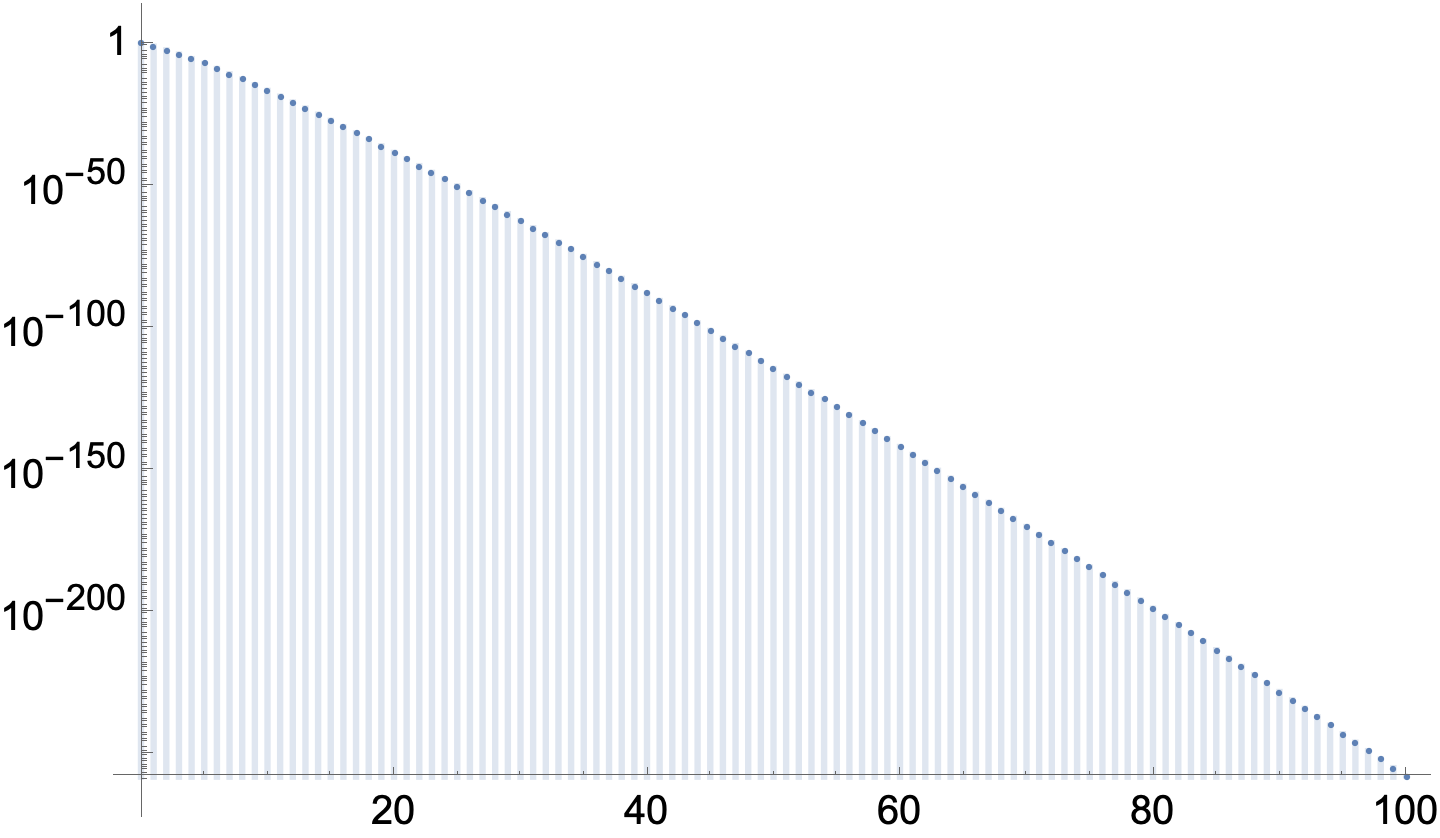
I need help tabulating and visualizing the expression, 0.905*0.1^n)/n!, where n goes from 0 to 100.
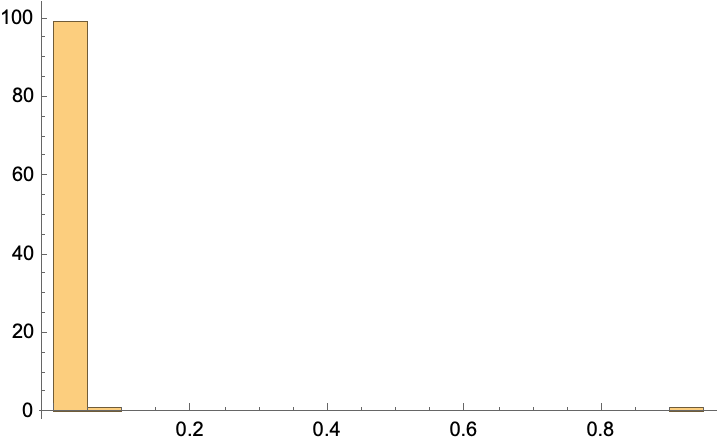
I want to store all the values, and use those values to plot a histogram.
I have used NsolveValues[{(0.905*0.1^n)/n!}], but am having issues extracting the data and then using that data to draw a histogram. Please help? I am a beginner so help would be much appreciated!


Datasethas specialized meaning in Mathematica. As a starting point, you can explore theTablecommand. You can edit your post by clicking on theEditlink under your post and format code using the{ }icon once you are in the Edit window. Thanks. $\endgroup$NDSolveValueis a command for differential equations. What you have provided is not. Is it possible that you forgot to copy some terms in your expression? $\endgroup$Histogram$\endgroup$Chopvery useful $\endgroup$