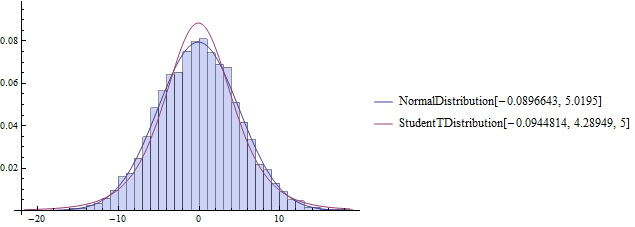
I want to draw a histogram and some line plots together. I have one observed variable and several predicted ones. Observed data should be shown as a histogram and the predicted variables should be shown as line plots or smooth histograms. I use Mathematica 7. Please help me to show which fitted distribution is best.
$\begingroup$
$\endgroup$
2
-
1$\begingroup$ No code?$\phantom{}$ $\endgroup$– J. M.'s missing motivation ♦Commented Jun 4, 2013 at 2:26
-
1$\begingroup$ Sharing your research helps everyone. Tell us what you found and why it didn’t meet your needs. This demonstrates that you’ve taken the time to try to help yourself, it saves us from reiterating obvious answers, and most of all it helps you get a more specific and relevant answer:) Good Luck! $\endgroup$– WolframFanCommented Jun 4, 2013 at 2:35
Add a comment
|
1 Answer
$\begingroup$
$\endgroup$
7
Something like this?
data = RandomVariate[NormalDistribution[0, 5], 10^4];
dist = {EstimatedDistribution[data, NormalDistribution[mu, sigma]],
   EstimatedDistribution[data, StudentTDistribution[mu, sigma, 5]]};
pdfs = PDF[#, x] & /@ dist;
Show[{Histogram[data, Automatic, "ProbabilityDensity"],
  Plot[pdfs, {x, Min[data], Max[data]}, PlotLegends -> dist]}]

-
$\begingroup$ yes I have same problem, but I have new distribution and real data set. I have calculated predicted values, so how I can sketch same histogram with data sets. $\endgroup$– SAANCommented Jun 4, 2013 at 5:25
-
$\begingroup$ Replace data with data={1,2,3,... } whatever your data set is and replace the NormalDistribution and StudentTDistribution with whatever you're using. $\endgroup$– CamCommented Jun 4, 2013 at 5:40
-
$\begingroup$ thanks Cam for your reply, data={1,2,3,..} works but how i can replace NormalDistribution with the expression? $\endgroup$– SAANCommented Jun 4, 2013 at 6:14
-
$\begingroup$ Just change dist, like this dist = {EstimatedDistribution[data,SkewNormalDistribution[mu, sigma, alpha]]} $\endgroup$– CamCommented Jun 4, 2013 at 6:22
-
1$\begingroup$ Really @Azeem, why are you being coy? Why not describe your problem in some detail (that is, edit your question), and maybe include this multiparameter distribution you speak of? $\endgroup$ Commented Jun 5, 2013 at 3:50
