I would like to create a 2D contour plot inside a closed region where the latter is produced by generating a parametric plot of a piecewise parametric function and then using BoundaryDiscretizeGraphics. If I plot each parametric component over its domain and then combine the plots with Show, the closed region is produced. However, if I use Piecewise to define the function and then produce the parametric plot, the closed region is not produced. I would much rather work with a single piecewise defined function, and thus would like to know what I am doing incorrectly. Any suggestion would be greatly appreciated. Below is a simple example of a triangular region that illustrates the problem.
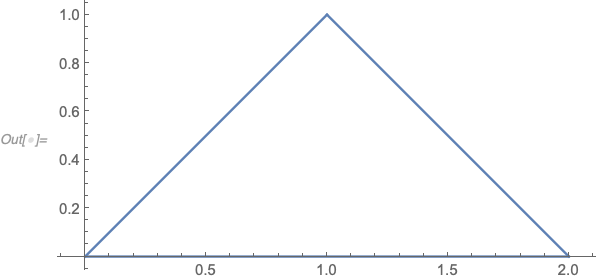
With Piecewise
x[s_] = Piecewise[{{s, 0 <= s < 1}, {s, 1 <= s < 2}, {2 (3 - s),
    2 <= s < 3}}]

y[s_] = Piecewise[{{s, 0 <= s < 1}, {2 - s, 1 <= s < 2}, {0,
    2 <= s < 3}}]
plot01 = ParametricPlot[{x[s], y[s]}, {s, 0, 3}]
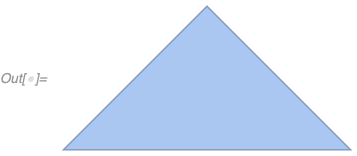
BoundaryDiscretizeGraphics[plot01]
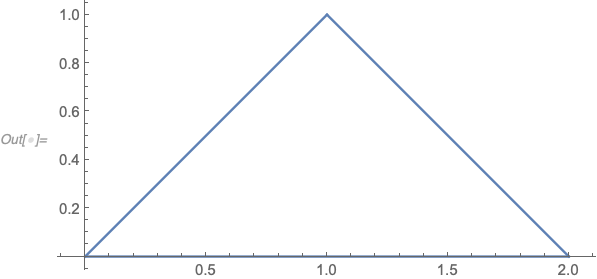
Without Piecewise
plot01 = ParametricPlot[{s, s}, {s, 0, 1}];
plot02 = ParametricPlot[{s, 2 - s}, {s, 1, 2}];
plot03 = ParametricPlot[{2 (3 - s), 0}, {s, 2, 3}];
plot04 = Show[{plot01, plot02, plot03}, PlotRange -> All]
BoundaryDiscretizeGraphics[plot04]


