1
$\begingroup$

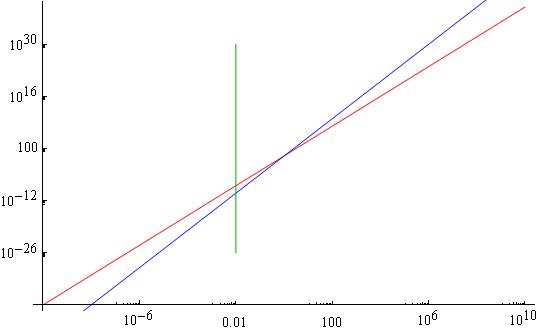
I wish to have a few plots on the same graph: ListLogLogPlot, LogLogPlot and a ParametricPlot drawing lines perpendicular to the x-axis. The problem is however that ParametricPlot doesn't seem to have the LogLog equivalent, as the other Plot functions do, and Show does not combine non-LogLog plots with LogLog plots, even when they coincide, eg.:

Show[LogLogPlot[x^4, {x,10^(-10),10^10}], Plot[x^5, {x,10^(-10),10^10}]]

should theoretically show two straight lines, but shows only one. Is there a way to combine such graphics without resolving to using non-LogLog plots?

$\endgroup$
1
  • $\begingroup$ @Öskå Well, it was just an example... Anyway thanks for pointing it out! $\endgroup$
    – Lurco
    Commented Jul 10, 2014 at 11:15

1 Answer 1

2
$\begingroup$

Try this:

    Show[{
  LogLogPlot[x^4, {x, 10^(-10), 10^10}, PlotStyle -> Red], 
  LogLogPlot[x^5, {x, 10^(-10), 10^10}, PlotStyle -> Blue],
  ParametricPlot[{Log[0.01], Log[y]}, {y, 10^-26, 10^30}, 
   PlotStyle -> Darker@Green]
  }]

enter image description here

$\endgroup$
1
  • $\begingroup$ Wow, it works! I thought I tested out this possibility as well... Anyway it makes sense $-$ thanks! $\endgroup$
    – Lurco
    Commented Jul 11, 2014 at 18:21

Your Answer

By clicking “Post Your Answer”, you agree to our terms of service and acknowledge you have read our privacy policy.

Not the answer you're looking for? Browse other questions tagged or ask your own question.