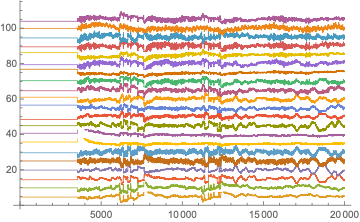
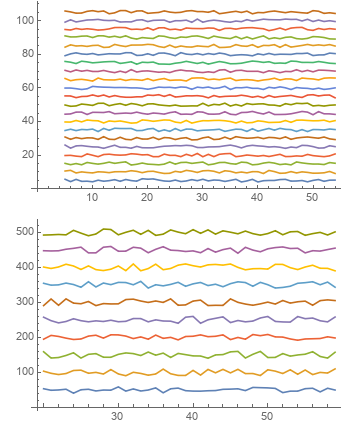
I have a for loop that produces a few line plots. After it is produced, it is appended together, and I'm using the "Show" command to combine the plots together. As shown in the example code below:
For[l = 1, l <= 21, l++,
  a = ListLinePlot[(mylist[[l]] + l*5)];
  AppendTo[z, a]];
Show[z, PlotRange -> All] // Print)]
"mylist" is time series data. Looping through it and adding multiples of 5 with the code above allows me to produce a plot as the image below:
I'd like to now combine a few plots that are produced this way in a grid. I have tried using an outer "for" loop, and the command GraphicsGrid, but that doesn't seem to work. Are there any other ways I can go about this? Thanks.


mylistlook like? $\endgroup$