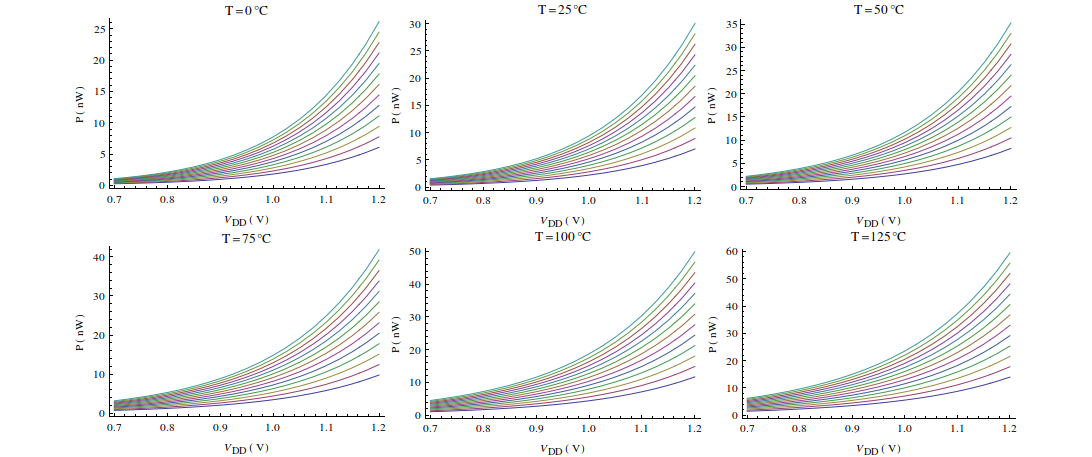
I have used ListLinePlot to generate this grid of plots:

and I want to add a legend in Row Layout below this grid. My code, has as follows:
graphs = Table[
   ListLinePlot[
    Table[Transpose@{vdd, power[[i, j, All]]}, {j, 1, Wl}],
    PlotLabel -> "T=" <> ToString[T[[i]]] <> "\[Degree]C",
    Frame -> {{True, False}, {True, False}},
    FrameLabel -> {"\!\(\*SubscriptBox[\(V\), \(DD\)]\)(V)","P(nW)"},
    AspectRatio -> 1/GoldenRatio,
    ImageSize -> Medium
    ],
   {i, 1, Tl}];
a = {graphs[[1 ;; 3]], graphs[[4 ;; 6]]};
grid = GraphicsGrid[a, Spacings -> Scaled[0],
   AspectRatio -> 0.6/GoldenRatio];
where vdd[[...]], W[[...]], T[[...]],power[[...,...,...]] are lists with the measured values and each colored curve in the above plots, corresponds for a different (but known) value of W.
I was thinking to use
Column[{grid,
  LineLegend[{...colors...}, Table[ToString[W[[n]]]<>"nm",{n,1,Wl}],
   LegendLayout -> "Row"]}]
but I cannot generate the default colour pallete, which Mathematica uses. Also, I need the legend to be justified to the center (presentation purposes, as you can see).
Any help please?


ColorData[1, "ColorList"]. $\endgroup$Column[{grid, LineLegend[ColorData[1, "ColorList"], Table[ToString[Round@W[[n]]] <> "nm", {n, 1, Wl}], LegendLayout -> "Row"]}]. The problem now is that the legend entries are not in one row and they are not justified. Anyway great help in so little time! $\endgroup$LineLegend[1, labels,...]is the shorter version ofLineLegend[ColorData[1,"ColorList"], labels, ...]. To prevent line-wrapping you can use something likeLineLegend[1, labels, LegendLayout -> (Pane[Row[Flatten@#, Spacer[3]], 1200] &)]orLineLegend[1, labels, LegendLayout -> (Pane[Grid[{Flatten@#}], 1200] &)]. $\endgroup$