2
$\begingroup$

I have two graphics for a visualization that both depend on the same parameter (an angle). I'd like for both graphics to be controlled by the same slider, but I can't have the graphics overlay each other using Show as they need to stay separate. Any idea how to do this?

 "p2=VectorPlot[{(3Cos[ArcTan[x/y]]Sin[ArcTan[x/y]]),(2Cos[ArcTan[x/y]]\
 Cos[ArcTan[x/y]]-Sin[ArcTan[x/y]]Sin[ArcTan[x/y]])},{x,-2,2},{y,-2,2}]"
 Manipulate[Show[
 p2, Graphics[{Thick, Arrow[{{1 - 0.5 Sin[\[Theta]],  0.5 - 0.5 Cos[\[Theta]] - 0.5}, {1 + 0.5 Sin[\[Theta]], 0.5 + 0.5 Cos[\[Theta]] - 0.5}}],Arrow[{{0, -0.5}, {0, 0.5}}]}, Axes -> False]], {\[Theta], 0, 
 2 Pi}]
 "p1=Plot[Cos[\[Theta]],{\[Theta],0,2 Pi}]"
 Manipulate[
 Show[p1, Graphics[{PointSize[Large], Red, Point[{\[Theta], Cos[\[Theta]]}]}]], {\[Theta], 0, 2 Pi}]

enter image description here enter image description here

$\endgroup$
3
  • $\begingroup$ Use Row or Column: e.g. Row[{plot1, plot2}] within Manipulate. $\endgroup$
    – MarcoB
    Jun 3, 2020 at 15:19
  • $\begingroup$ Welcome to Mathematica StackExchange. In order to learn how to use this site take the tour. When copying equations from a notebook to your question one should format using inline code by selecting the code and clicking the {} button above the edit window. It is recommended that you browse the Markdown help $\endgroup$ Jun 3, 2020 at 15:22
  • $\begingroup$ At this point, may I also suggest that you use ArcTan[y, x] instead of ArcTan[x/y]; the former is more suitable for the application you seem to have. $\endgroup$ Jun 3, 2020 at 15:46

1 Answer 1

2
$\begingroup$

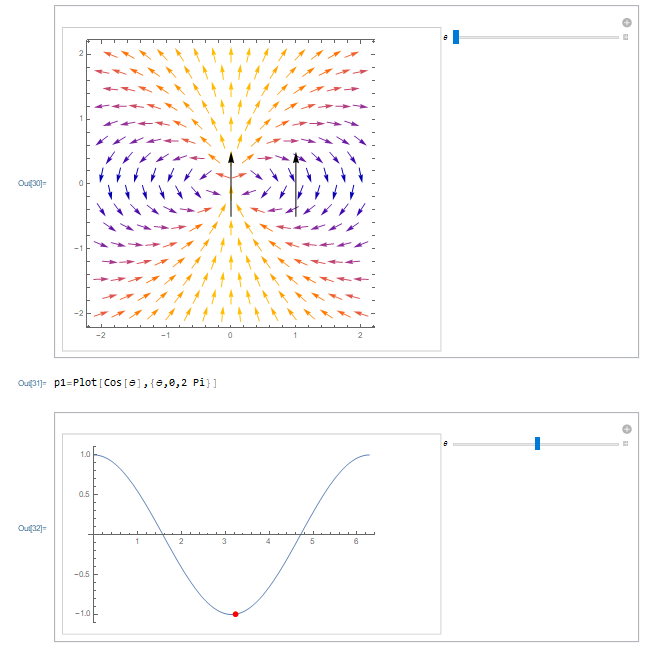
One way is to place both the Shows inside a Column within Manipulate (not quite clear to me if the two graphics in a column is acceptable to you).

p1 = Plot[Cos[\[Theta]], {\[Theta], 0, 2 Pi}];
p2 = VectorPlot[{
   (3 Cos[ArcTan[x/y]] Sin[ArcTan[x/y]]),
   (2 Cos[ArcTan[x/y]] Cos[ArcTan[x/y]] - 
     Sin[ArcTan[x/y]] Sin[ArcTan[x/y]])
   },
  {x, -2, 2},
  {y, -2, 2}
  ];

and then the Manipulate

Manipulate[
 Column[
  {
   Show[
    p2,
    Graphics[
     {
      Thick,
      Arrow[{
        {1 - 0.5 Sin[\[Theta]], 0.5 - 0.5 Cos[\[Theta]] - 0.5},
        {1 + 0.5 Sin[\[Theta]], 0.5 + 0.5 Cos[\[Theta]] - 0.5}
        }
       ],
      Arrow[
       {
        {0, -0.5}, {0, 0.5}
        }
       ]
      },
     Axes -> False
     ],
    ImageSize -> 400
    ],
   Spacer[10],
   Show[
    p1,
    Graphics[
     {
      PointSize[Large],
      Red,
      Point[{\[Theta], Cos[\[Theta]]}]
      }
     ],
    ImageSize -> 400
    ]
   }
  ],
 {\[Theta], 0, 2 Pi}
 ]

enter image description here

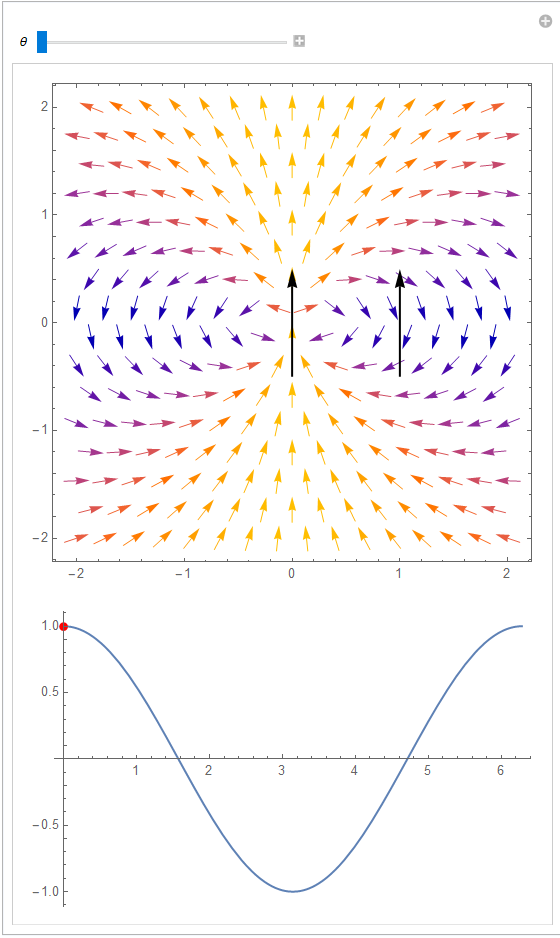
If you truly want them separated one can take control by using Dyanmic.

{Slider[Dynamic[\[Theta]], {0, 2 \[Pi]}], Dynamic[\[Theta]]}

enter image description here

and then

Dynamic[
 Show[
  p2,
  Graphics[
   {
    Thick,
    Arrow[{
      {1 - 0.5 Sin[\[Theta]], 0.5 - 0.5 Cos[\[Theta]] - 0.5},
      {1 + 0.5 Sin[\[Theta]], 0.5 + 0.5 Cos[\[Theta]] - 0.5}
      }
     ],
    Arrow[
     {
      {0, -0.5}, {0, 0.5}
      }
     ]
    },
   Axes -> False
   ],
  ImageSize -> 400
  ]
 ]

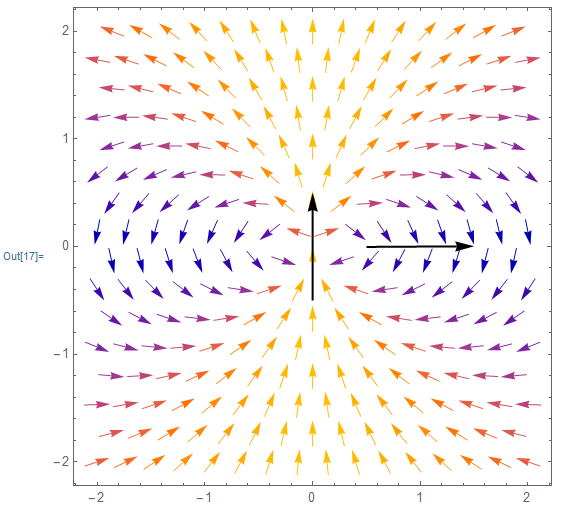
enter image description here

Dynamic[
 Show[
  p1,
  Graphics[
   {
    PointSize[Large],
    Red,
    Point[{\[Theta], Cos[\[Theta]]}]
    }
   ],
  ImageSize -> 400
  ]
 ]

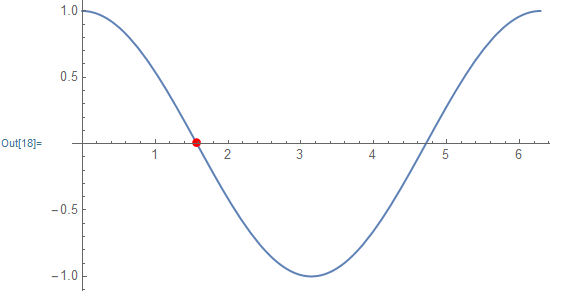
enter image description here

Note: The newlines and spacing I use in the code are completely unnecessary. I just do that to help myself keep track of the level.

$\endgroup$

Your Answer

By clicking “Post Your Answer”, you agree to our terms of service and acknowledge you have read our privacy policy.

Not the answer you're looking for? Browse other questions tagged or ask your own question.