1
$\begingroup$

The expression in polar coordinate is

LGo[l_, m_, V_, R_, ϕ_] := R^l LaguerreL[m - 1, l, V R^2] Exp[-1/2 V R^2] Cos[l ϕ];

where l,m,V are parameters, and R,phi are variable. However, It can't be visualized by Polar Plot.

Is there any way to show it?

$\endgroup$
1
  • $\begingroup$ Are you still looking for an answer? $\endgroup$
    – zhk
    Commented Mar 29, 2017 at 10:28

2 Answers 2

1
$\begingroup$

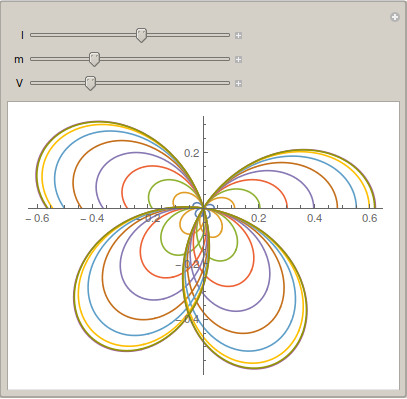
There are several ways. One easy solution is to create a Table for several radii and plot them or use them in a Manipulate

LGo[l_, m_, V_, R_, ϕ_] := 
  R^l LaguerreL[m - 1, l, V R^2] Exp[-1/2 V R^2] Cos[l ϕ];

Manipulate[
 With[{expr = Table[LGo[l, m, V, r, phi], {r, 0.1, 1, 0.1}]},
  PolarPlot[expr, {phi, 0, 2 Pi}]
  ],
 {l, 1, 2},
 {m, 1, 2},
 {V, 1, 2}
 ]

Mathematica graphics

$\endgroup$
1
  • $\begingroup$ Thank you, but it seems that the result is not the same as desired. Is there any way to transform the expression to Cartesian coordinate and use ContourPlot ? $\endgroup$
    – YOUNGHI
    Commented Mar 16, 2017 at 10:57
0
$\begingroup$

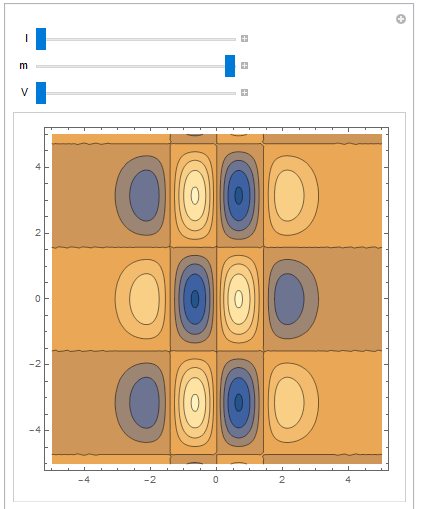
In response to OP's comment,

Is there any way to transform the expression to Cartesian coordinate and use ContourPlot?

R1 = Sqrt[x^2 + y^2];
ϕ = ArcTan[y/x];
LGo[l_, m_, V_, R_, ϕ_] := R1^l LaguerreL[m - 1, l, V R1^2] Exp[-1/2 V R1^2] Cos[l ϕ];
Manipulate[ ContourPlot[LGo[l, m, V, x, y], {x, -5, 5}, {y, -5, 5}, 
                        PerformanceGoal -> "Quality"], {l, 1, 2}, {m, 1, 2}, {V, 1, 2}]

enter image description here

$\endgroup$
1
  • $\begingroup$ Thank you very much. I have replace R and phi to x and y by the converter formula directly. The result is correct now. $\endgroup$
    – YOUNGHI
    Commented Mar 17, 2017 at 2:14

Your Answer

By clicking “Post Your Answer”, you agree to our terms of service and acknowledge you have read our privacy policy.

Not the answer you're looking for? Browse other questions tagged or ask your own question.