1
$\begingroup$

I have to do a Plot3D of a given function which takes very long, so I would like to have an idea of how long it would be. I am looking for the simplest way to monitor this.

Here is my code (well not exactly the one I use but I made a simpler example) :

H2[x_] := If[x != 0, If[x != 1, (-x)*Log[x] - (1 - x)*Log[1 - x], 0], 0]
Si[Theta_] := H2[Cos[Theta/2]^2]
kb = 1; 
WextMaxOuiDegenBruitTh[T_, ΔI_] := (-kb)*T*ΔI
ηOuiDegenBruitTh[T_, ΔI_] := WextMaxOuiDegenBruitTh[T, ΔI]/Abs[ΔI]

Plot3D[ηOuiDegenBruitTh[Theta, ΔI], {Theta, 0, Pi/2}, {ΔI, -Log[2], 0}, 
 RegionFunction -> Function[{Theta, ΔI}, -Si[Theta] < ΔI < 0], PlotPoints -> 10]

As you can see I gave the PlotPoints parameter in my Plot3D so maybe there is a way to tell Mathematica to use the number of points it will have to compute on the plot to make a progress bar from it. But I don't know how to do that.


[EDIT] As suggested in the comment of the answer below, I can use EvaluationMonitor to help me. However, I don't understand something. I changed my Plot3D line by replacing it with this for the example (all the code before is unchanged).

Plot3D[ηOuiDegenBruitTh[Theta, ΔI], {Theta, 0, Pi/2}, {ΔI, -Log[2], 0}, PlotPoints -> 20, 
 EvaluationMonitor -> Print["x"]]

As written in the documentation, I should have 20*20 points in this calculation, so 400 calculations in the end.

But when I run this line Mathematica only output "x" 3 times. So it is like Mathematica only did 3 calculations and not 400.

My problem is linked to the fact I probably misunderstood how EvaluationMonitor works, but I don't know where I am wrong!


[EDIT for MarcoB]: My exact line is :

Monitor[
  Plot3D[
   ηOuiDegenBruitTh[Theta, ΔI], {Theta,0, Pi/2}, {ΔI, -Log[2], 0}, 
   PlotPoints -> 100, MaxRecursion -> 0, EvaluationMonitor :> (x = x + 1)
  ], 
  ProgressIndicator[x, {0, 200^2}]
]
$\endgroup$
9
  • 1
    $\begingroup$ Note: EvaluationMonitor requires delayed rules, :> instead of ->. $\endgroup$ Commented Jun 5, 2018 at 16:18
  • $\begingroup$ @AccidentalFourierTransform indeed now i think it works. Just to understand (i'm not sure to really understand the help page for :>), what does it exactly do in my example ? I know it is linked to a delay but with the -> what did the code do in this specific example ? $\endgroup$
    – StarBucK
    Commented Jun 5, 2018 at 16:21
  • $\begingroup$ see mathematica.stackexchange.com/q/111051/34893 $\endgroup$ Commented Jun 5, 2018 at 16:23
  • 1
    $\begingroup$ @AccidentalFourierTransform one little extra question : with PlotPoints->100 for my plot depending of two variables, mathematica doesn't use 100^2 points but 200^2. Isn't it supposed to use 100 sample points in each direction ? So 100 in x and 100 in y then 100*100 ? Why 200*200 ? $\endgroup$
    – StarBucK
    Commented Jun 5, 2018 at 16:40
  • 1
    $\begingroup$ @StarBucK It turns out that the extra points are due to the calculation of vertex normals for the surface. See also: Why does Plot3D appear to traverse the points twice?. This seems really important in fact, and I wish the documentation mentioned it explicitly, since three quarters of the time spent in Plot3D with a non-trivial function seem to be due to these extra calculations. You can turn that off using NormalsFunction -> None. This may affect visual properties of the graphic, so test it out. $\endgroup$
    – MarcoB
    Commented Jun 6, 2018 at 16:24

1 Answer 1

1
$\begingroup$

Is this what you want?

Table[{j,
       AbsoluteTiming[Plot3D[\[Eta]OuiDegenBruitTh[Theta, \[CapitalDelta]I], {Theta, 0, Pi/2}, {\[CapitalDelta]I, -Log[2], 0}, RegionFunction -> Function[{Theta, \[CapitalDelta]I}, -Si[Theta] < \[CapitalDelta]I < 0], PlotPoints -> j]][[1]]
      }
, {j, 10, 200, 10}]

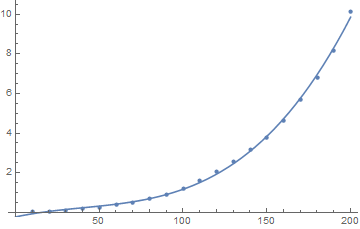
Fit[%, {1, x, x^2, x^3}, x]
Show[ListPlot[%%], Plot[%, {x, 0, 200}]]

enter image description here

You can use the Fitted formula to estimate how long it will take to plot your function to any desired number of points. Extrapolating can be misleading though, so use at your own risk.

If you also want to see the progress bar while the plot is being completed, you can use any of the options in How to create a progress bar?. For example, using the very first piece of code by Brett Champion, I get

count = 0;
Monitor[
        Plot[Sin[x], {x, -1, 1}, EvaluationMonitor :> (Pause[.1]; (count++)),
        PlotPoints -> 100, MaxRecursion -> 0]
, Row[{ProgressIndicator[count, {1, 100}], count}, " "]]

Here I plotted a Sin function for simplicity, but it is trivial to adapt this to your 3d function. I leave this to you.

$\endgroup$
4
  • $\begingroup$ Note: I fitted the data to a cubic formula because that's what the log-log plot seemed to suggest. If you calculate more points, you will be able to convince yourself that my guess is correct, or find a better one otherwise. $\endgroup$ Commented Jun 5, 2018 at 15:59
  • $\begingroup$ Thanks for your answer. So here if I understand well you made a code that once the calculation is ended give you the time occured for this calculation. And from it you try to predict how long it will take for longer calculations. What I would like to do if it is possible is to have a progress bar during the ongoing computation. The progress bar could use the fact we ask for the Plot3D 10 plotPoints (so in theory mathematica knows how much steps are remaining, and it "could" make a progress bar from it). But I don't know if it is possible in practice $\endgroup$
    – StarBucK
    Commented Jun 5, 2018 at 16:04
  • 1
    $\begingroup$ Sure: use EvaluationMonitor together with any of the answers in How to create a progress bar?. (You will have to use MaxRecursion -> 0 to make sure Plot3D uses exactly PlotPoints points, and no more). $\endgroup$ Commented Jun 5, 2018 at 16:07
  • $\begingroup$ I edited my message, I still don't get something. $\endgroup$
    – StarBucK
    Commented Jun 5, 2018 at 16:16

Your Answer

By clicking “Post Your Answer”, you agree to our terms of service and acknowledge you have read our privacy policy.

Not the answer you're looking for? Browse other questions tagged or ask your own question.