0
$\begingroup$

I have a function that I'm trying to visualize and for some reason the plot only shows a small snippet of the graph of the function. The function, d, and relevant values are as follows:

    G = 6.67*10^(-11)
    c = 3*10^8
    M = 10^(30)
    J = 10^(20)
    \[Gamma] = 0.018
    rmin = M  + Sqrt[M^2 - J^2/M^2]

    d[r_, \[Theta]_] = 1 - (2 G M r)/(c^2 r^2 + J^2/M^2 Cos[\[Theta]]^2) 
                       - (Sin[\[Theta]]^2 \[Gamma]^2)/c^2 (r^2 + J^2/(M^2 c^2) + ( 2 G J^2 r Sin[\[Theta]]^2)/(c^4 M (r^2 + J^2/(M^2 c^2) Cos[\[Theta]]^2))) 
                       + (8 \[Gamma] G r J Sin[\[Theta]]^2)/(c^4 (r^2 + J^2/(M^2 c^2) Cos[\[Theta]]^2))

The exact values of \[Gamma], M and J aren't particularly significant, although M and J are meant to be large. I'm trying to plot the graph of this function using Plot3D

     Plot3D[
            d[Sqrt[x^2 + y^2], ArcCos[x/Sqrt[x^2 + y^2]]], 
            {x, 0, 3 M}, 
            {y,0, 6 M}, 
            RegionFunction -> Function[{x, y, z}, rmin < Sqrt[x^2 + y^2] ]
           ]

I'm really new when it comes to working with mathematica, but I've seen online that sometimes varying PlotPoints and MaxRecursion can help to fix a plot. I tried setting PlotPoints -> {50, 100, 1000}, as well as MaxRecursion -> 10 (I don't if these values are high or low w.r.t Mathematica's default settings), changing these tended to make Mathematica really sluggish, moreover they didn't produce any more of the plot. I've also tried setting ClippingStyle -> None and PlotRange -> All and none of these had any effect.

I'm thinking that maybe It could be the large values that might be throwing Mathematica off, but I was under the impression that Mathematica could deal with 'astronomical numbers' (literally). Anyway if anybody has any insight into what's going wrong or just helpful advice it would be very much appreciated.

EDIT: In the comments it was mentioned that (0,0) is a potential problem, but I have an analogous function

    M = 10
    J = 1
    \[Gamma] = 0.018

    g[r_, \[Theta]_] = 1 - 2 M r/(r^2 + J^2/M^2 Cos[\[Theta]]^2) 
                       - \[Gamma]^2 Sin[\[Theta]]^2 (r^2  + J^2/M^2 + 2 r J^2 Sin[\[Theta]]^2/(M (r^2 + J^2/M^2 Cos[\[Theta]]^2))) 
                       + \[Gamma] 8 r J Sin[\[Theta]]^2/(r^2 + J^2/M^2 Cos[\[Theta]]^2)

Which in principle is the same, and should encounter the same issue at (0,0), but Plot3D manages just fine.

$\endgroup$
5
  • $\begingroup$ It looks like you are dividing by zero somewhere: check your equation $\endgroup$
    – mattiav27
    Commented May 16, 2014 at 19:23
  • $\begingroup$ Problably it is when Math. encounters the point (0,0) $\endgroup$
    – mattiav27
    Commented May 16, 2014 at 19:28
  • $\begingroup$ I think you forgot to post he definition of q ... $\endgroup$
    – Szabolcs
    Commented May 16, 2014 at 19:30
  • $\begingroup$ Sorry that q was supposed to be a d, and it's true that at (0,0) there is a singularity, but doesn't RegionFunction exclude that point? $\endgroup$ Commented May 16, 2014 at 19:33
  • $\begingroup$ @mattiav27 I tried omitting (0,0) from the domain and still no plot, but thanks for the suggestion. $\endgroup$ Commented May 16, 2014 at 19:46

1 Answer 1

2
$\begingroup$

It is simply an issue with the extreme plot range:

 typical = 
    With[{y = 6 M , x = 3 M}, 
       d[Sqrt[x^2 + y^2], ArcCos[x/Sqrt[x^2 + y^2]]]]

-1.296*10^41

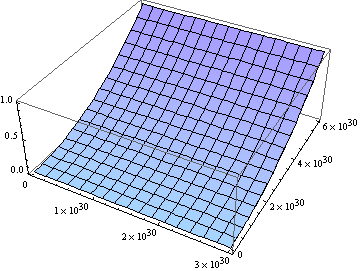
 Plot3D[d[Sqrt[x^2 + y^2], ArcCos[x/Sqrt[x^2 + y^2]]]/typical, {x, 0, 3 M}, {y, 0, 6 M}]

enter image description here

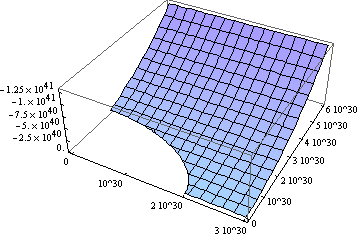
put the proper tics on the axis, and using your RegionFunction:

 Plot3D[d[Sqrt[x^2 + y^2], ArcCos[x/Sqrt[x^2 + y^2]]]/typical,
    {x, 0,3 M}, {y, 0, 6 M} , 
    RegionFunction -> Function[{x, y, z}, rmin < Sqrt[x^2 + y^2]], 
    Ticks -> {Automatic, Automatic, 
         Table[-i 10^41  {1/typical , 1}, {i, 0, 1.5, .25}]}]

enter image description here

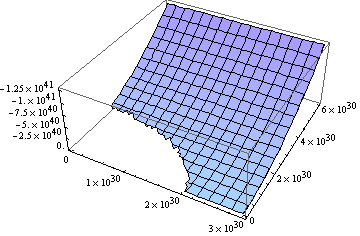
Likewise the jagginess on the hole left by the regionfunction is cleaned up by normalizing the x,y ranges:

 sx = 1. 10^30;
 Plot3D[d[sx Sqrt[x^2 + y^2], ArcCos[x/Sqrt[( x)^2 + ( y)^2]]]/typical,
     {x, 0, 3 }, {y, 0, 6} , 
     RegionFunction -> Function[{x, y, z}, rmin/sx < Sqrt[x^2 + y^2]],
     Ticks -> {Table[{i, i  sx}, {i, 0, 3}], Table[{i, i  sx}, {i, 0, 6}],
               Table[-i 10^41 {1/typical, 1}, {i, 0, 1.5, .25}]}]

enter image description here

$\endgroup$
1
  • $\begingroup$ This is perfect. Thank you for the comprehensive answer! $\endgroup$ Commented May 17, 2014 at 17:34

Your Answer

By clicking “Post Your Answer”, you agree to our terms of service and acknowledge you have read our privacy policy.

Not the answer you're looking for? Browse other questions tagged or ask your own question.