6
$\begingroup$

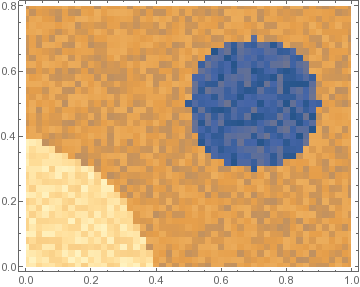
I have a dataset which supposed to show some regions. For example

r1 = Disk[{-0.1, -0.1}, 0.5];
r2 = Disk[{0.7, 0.5}, 0.2];
ran = 0.25; (*random amplitude*)
f[x_, y_] := Which[RegionMember[r1, {x, y}], 1 + RandomReal[{-ran, ran}], 
              RegionMember[r2, {x, y}], -1 + RandomReal[{-ran, ran}], True, 
              RandomReal[{-ran, ran}]]
data = Table[{x, y, f[x, y]}, {x, 0, 1, 0.02}, {y, 0, 0.8, 0.02}]~ Flatten~1;
ListDensityPlot[data, InterpolationOrder -> 0, PlotRange -> All, AspectRatio -> 4/5]

enter image description here

And I want to extract the edges of the r1 and r2.

I try to convert the data into an image and use EdgeDetect.

ndat = Length[data]
{zmin, zmax} = MinMax@data[[All, 3]]
Do[If[data[[n, 1]] != data[[n + 1, 1]], ny = n; Break[]], {n, ndat}];
nx = ndat/ny;

imdata = Partition[data[[All, 3]], ny];
imdata = Table[(imdata[[j, ny - i + 1]] - zmin)/(zmax - zmin), {i, ny}, {j, nx}];
img = Image[imdata];

pts = PixelValuePositions[EdgeDetect[img], 1];
pts = Partition[data[[All, 1 ;; 2]], ny][[#[[1]], #[[2]]]] & /@ pts;
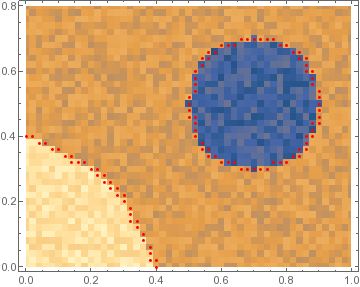
ListDensityPlot[data, InterpolationOrder -> 0, PlotRange -> All, AspectRatio -> 4/5,
                Epilog -> {Red, Point[pts]}]

enter image description here

In this way,

  1. I cannot isolate the regions - for example, the edges of the circle and the quarter circle in the corner.

  2. I cannot find a smooth line for the edges.

  3. It does not work very well when I increase the noise (say ran=0.5).

How to find the separate edges as isolated lines/lists?

$\endgroup$

3 Answers 3

3
$\begingroup$

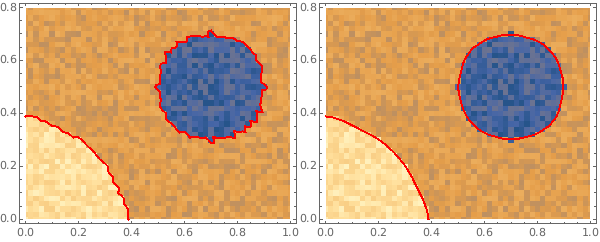
You can (1) use ListDensityPlot with options InterpolationOrder -> 1 and MeshFunctions to create mesh lines, and (2) use the function smoothCP from this answer to smooth the mesh lines:

ClearAll[smoothCP]
smoothCP = Module[{pr = PlotRange @ #,  nF =  Nearest[Join @@ Cases[Normal @ #, 
       Line[a_] :> Transpose[#2 /@ Transpose@a], ∞]]},
   # /. GraphicsComplex[a_, b__] :> GraphicsComplex[ 
       If[Or @@ MemberQ @@@ Thread @ {pr, #}, #, First @ nF @ #] & /@ a, b] ] &;
   
ldp1 = ListDensityPlot[data, InterpolationOrder -> 0, 
   PlotRange -> All, AspectRatio -> 4/5, ImageSize -> 300];
ldp2 = ListDensityPlot[data, InterpolationOrder -> 1, 
   PlotRange -> All, AspectRatio -> 4/5, ImageSize -> 300, PlotStyle -> None,
   MeshFunctions -> {Round@#3 &}, Mesh -> 2, MeshStyle -> Directive[Thick, Red]];

 Row[{Show[ldp1, ldp2], Show[ldp1, smoothCP[ldp2, GaussianFilter[#, {5, 5}] &], 
   PlotRange -> All]}]

enter image description here

Is it possible to extract the contours as separate lists?

To extract the smoothed lines, you can use

lines = Cases[Normal[smoothCP[ldp2, GaussianFilter[#, {5, 5}] &]], _Line, Infinity]
Short /@ lines

{Line[{{0., 0.387454}, << 58 >>, {0.392532, 0.}}],
Line[{{0.504121, 0.483339}, << 146 >>, {0.504121, 0.483339}}]}

To get just the coordinates of the two lines, use Line[x_, ___]:>x instead of _Line above.

$\endgroup$
2
  • $\begingroup$ Is it possible to extract the contours as separate lists. I can see the points from smoothCP[ldp2, GaussianFilter[#, {5, 5}] &][[1, 1]] but cannot group them as separate lines. I am trying to get a list like {{{line1x1,line1y1},...},{{line2x1,line2y1},...},...}. $\endgroup$
    – Sumit
    Commented Jun 2, 2018 at 12:44
  • $\begingroup$ @Sumit, I updated with a way to extract the contours. $\endgroup$
    – kglr
    Commented Jun 2, 2018 at 12:53
3
$\begingroup$

The following function extractregion might be something to start with. First, it smoothes along the third entries in the data set by TotalVariationFilter. TTotalVariationFilter has the advantage over, e.g. GaussianFilter, that it tends to preserve edge jumps, which is really desired here. Afterwards, we interpolate the smoothed data set, plot a ContourPlot, extract the contour lines, and convert them to a single MeshRegion.

extractregion[data_, level_, smoothing_] := 
 Module[{a, n, g, contour},
  a = data;
  n = FirstPosition[Unitize[Subtract[a[[1 ;; -2, 1]], a[[2 ;; -1, 1]]]], 1][[1]];
  a[[All, 3]] = Flatten[TotalVariationFilter[Partition[a[[All, 3]], n], smoothing]];
  g = Interpolation[a];
  contour = 
   ContourPlot[
    g[x, y] == level, {x, Sequence @@ g[[1, 1]]}, {y, Sequence @@ g[[1, 2]]}];
  RegionUnion@Map[
    gc \[Function] MeshRegion[gc[[1]], Cases[gc, _Line, All]],
    Cases[contour, _GraphicsComplex, All]
    ]
  ]

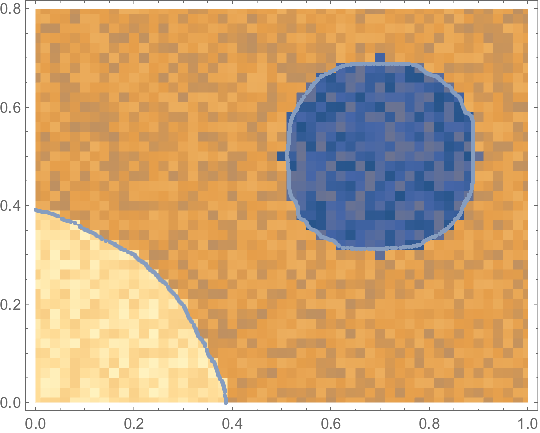
This is how it behaves on the provide example data:

Show[
 ListDensityPlot[data, InterpolationOrder -> 0, PlotRange -> All, 
  AspectRatio -> 4/5],
 extractregion[data, 0.5, 3],
 extractregion[data, -0.5, 1.2]
 ]

enter image description here

It doesn't close the quarter of the disk in the lower left corner. I don't now an elegant way to do that at the moment.

$\endgroup$
0
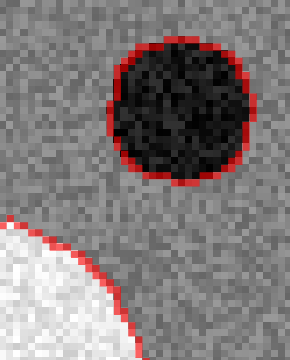
$\begingroup$
img = Image[Reverse@Rescale[Map[Last] /@ GatherBy[data, First]]];
HighlightImage[img, {Opacity[.6], FaceForm[Red], EdgeForm[], EdgeDetect[img]}]

$\endgroup$

Your Answer

By clicking “Post Your Answer”, you agree to our terms of service and acknowledge you have read our privacy policy.

Not the answer you're looking for? Browse other questions tagged or ask your own question.