6
$\begingroup$

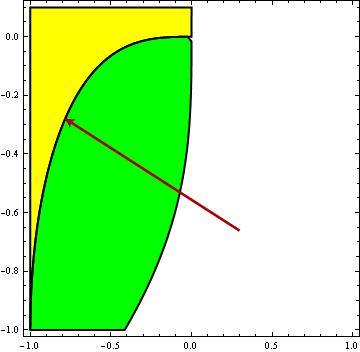
I have a problem with finding the function that gives the boundary curve in RegionPlot comamnd. I use the following code to make the regions in which two inequalities are held simultaneously

RegionPlot[{{x^3 - y^2 > 2 y && x^2 + y^3 > 2 x }, 
            {x^3 - y^2 < 2 y && x^2 + y^3 > 2 x }}, {x, -1, 1}, {y, -1, .1}, 
           PlotStyle -> {Green, Yellow}, BoundaryStyle -> {Black, Thick}]
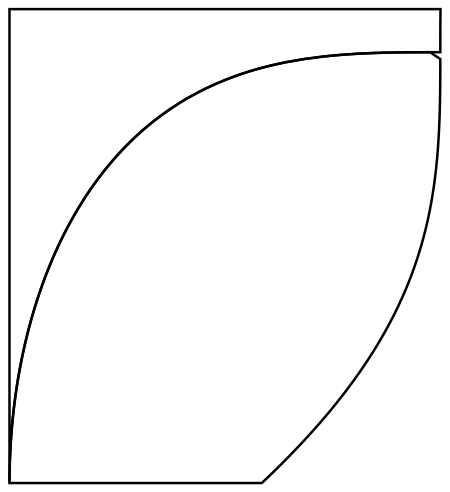
enter image description here

Here we see a black thick curve between the green and yellow regions, I mean the boundary that separates these regions (I showed it with a red arrow) .

Now, how can I find its equation or at least the list of points living on this curve?

$\endgroup$

3 Answers 3

5
$\begingroup$

The "canonical" way is to find a pattern (here, {Black, Thick}) that matches what the boundary is made of and extract it from the graphics object. So given

pt = RegionPlot[{{x^3 - y^2 > 2 y && 
     x^2 + y^3 > 2 x}, {x^3 - y^2 < 2 y && x^2 + y^3 > 2 x}}, {x, -1, 
   1}, {y, -1, .1}, PlotStyle -> {Green, Yellow}, 
  BoundaryStyle -> {Black, Thick}];

bdy=Cases[Normal@First@pt, {Black, Thick, __}, Infinity];

Graphics[bdy]

enter image description here

---EDIT 2---

In diagonally reading your question, I missed the requirement for the boundary between the two.

The following will work on the particular dataset. First, you can extract the points from the bdy:

points = Cases[bdy, Line[a___] -> a, Infinity]

and you will notice that there are two components each corresponding to one region. I thought that Intersection wouldn't work for the two but as @eldo points out, it turns out it does:

bdy = First /@ GatherBy[Intersection@@points, First] (* so that there are no duplicate x coords*);

gives the boundary points which can be fitted to a model of your liking or interpolate or whatever:

 fit = Interpolation[bdy, InterpolationOrder -> 1];

Plot[fit[x], {x, -1, 0},  
 Epilog -> {Red, PointSize -> Tiny, Point[points[[1]]~Join~points[[2]]]},
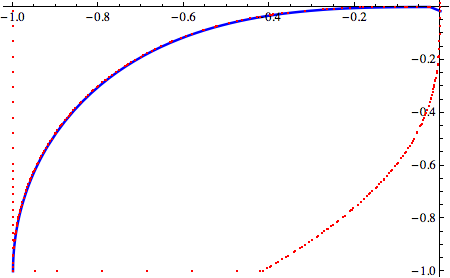
  PlotStyle -> {Blue, Thick}]

enter image description here

$\endgroup$
3
  • $\begingroup$ @gpap - Instead of working with "Nearest", couldn't one simply take the "Intersection" of the two components? $\endgroup$
    – eldo
    Commented Jun 4, 2014 at 11:46
  • $\begingroup$ Ehmmmmmmm......I thought that wouldn't work as the points wouldn't be the same but it seems to be working fine. I think this is a bad answer as it stands so maybe I should delete alltoghether.. $\endgroup$
    – gpap
    Commented Jun 4, 2014 at 11:49
  • $\begingroup$ please leave your answer since it's instructive, esp. the "Nearest"-function which I didn't know so far. Maybe you could make an addendum with "Intersection". - superseded, thanks gpap :) $\endgroup$
    – eldo
    Commented Jun 4, 2014 at 12:01
4
$\begingroup$
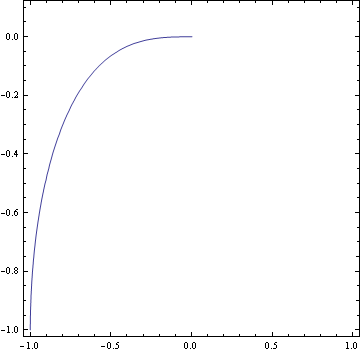
ContourPlot[x^3 - y^2 == 2 y, {x, -1, 1}, {y, -1, .1},
            RegionFunction -> (#^2 + #2^3 > 2 # &)]

enter image description here

The following procedure contains additional condition which you've provided by range for RegionPlot: {x, -1, 1}, {y, -1, .1}.

Reduce[x^3 - y^2 == 2 y && x^2 + y^3 > 2 x && Abs[x] <= 1 && -1 <= y <= .1, 
       {x, y}, Reals]
-1. <= x < 0 && y == -1. + Sqrt[1. + x^3]
$\endgroup$
2
$\begingroup$

Looking at the FullForm of

rp = RegionPlot[{{x^3 - y^2 > 2 y && 
      x^2 + y^3 > 2 x}, {x^3 - y^2 < 2 y && x^2 + y^3 > 2 x}}, {x, -1,
     1}, {y, -1, .1}, PlotStyle -> {Green, Yellow}, 
   BoundaryStyle -> {Black, Thick}];

with

rp // FullForm

you can easily see that

q = rp[[1, 1]]

and

p = First@Last@rp[[1]][[2]][[2]][[1]]

yielding

pointsoncurve = q[[p]]

Now,

ListPlot[pointsoncurve, Joined -> True, AspectRatio -> 1, 
 GridLines -> Automatic]

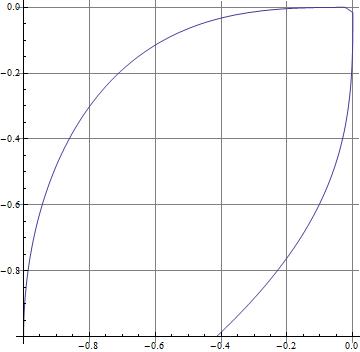
shows

enter image description here

It wouldn't be too difficult to "automate" this, esp. the finding of "p".

$\endgroup$
2
  • $\begingroup$ Of course, Kuba's answer is the right one here, but I leave mine in case the OP wants to see the list of points MM uses to draw the boundaries. $\endgroup$
    – eldo
    Commented Jun 4, 2014 at 10:23
  • $\begingroup$ Well, I've not provided the list of points so it's ok. The problem is that OP wants only the part of the border that separates both regions and here's more than that. $\endgroup$
    – Kuba
    Commented Jun 4, 2014 at 10:26

Your Answer

By clicking “Post Your Answer”, you agree to our terms of service and acknowledge you have read our privacy policy.

Not the answer you're looking for? Browse other questions tagged or ask your own question.