4
$\begingroup$

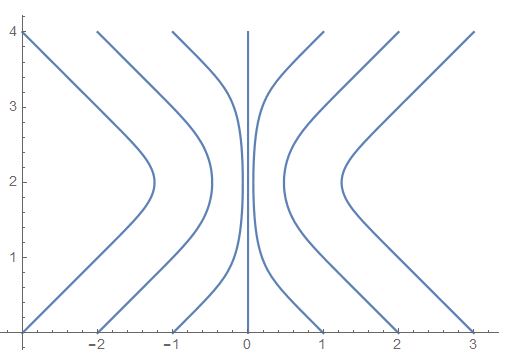
I have some code that works nicely, for what I want, but when I try to get a DensityPlot or ContourPlot, it will not work as it is a parametric equation using NDSolve. Is there a way to get a DensityPlot of this code?

 ClearAll["Global`*"]; Show[
  Table[sol = 
    NDSolve[{D[xtraj[t], 
        t] == (Sinh[2 xtraj[t] (t - 2)])/(Cosh[2 xtraj[t] (t - 2)]), 
      xtraj[0] == n}, xtraj[t], {t, 0, 4}];
    ParametricPlot[{xtraj[t], t} /. sol, {t, 0, 4}, 
  PlotRange -> All], {n, -3, 4 - 1, 1}]]

enter image description here

$\endgroup$

2 Answers 2

5
$\begingroup$

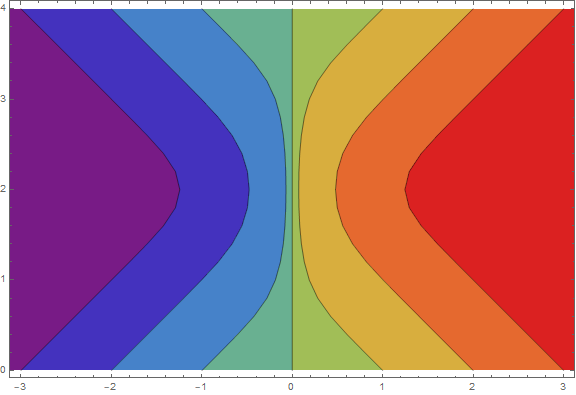
For a contour plot use,

ListContourPlot[Flatten[Table[
    s = NDSolveValue[{D[xtraj[t], t] == 
        (Sinh[2 xtraj[t] (t - 2)])/(Cosh[2 xtraj[t] (t - 2)]), 
        xtraj[0] == n}, xtraj, {t, 0, 4}];
    Table[{s[t], t, n}, {t, 0, 4, .2}], {n, -3.2, 3.2, .2}], 1], 
 Contours -> Range[-4, 4], ImageSize -> Large, PlotRange -> {{-3, 3}, Automatic},
 AspectRatio -> 2/3, ColorFunction -> "Rainbow"]

enter image description here

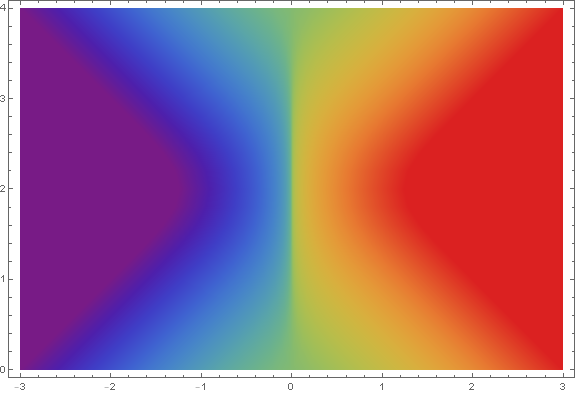
The code for a density plot is similar.

ListDensityPlot[Flatten[Table[
    s = NDSolveValue[{D[xtraj[t], t] == 
        (Sinh[2 xtraj[t] (t - 2)])/(Cosh[2 xtraj[t] (t - 2)]), 
        xtraj[0] == n}, xtraj, {t, 0, 4}];
    Table[{s[t], t, n}, {t, 0, 4, .2}], {n, -3, 3, .2}], 1], 
ImageSize -> Large, AspectRatio -> 2/3, ColorFunction -> "Rainbow"]

enter image description here

$\endgroup$
2
$\begingroup$

You can also use ParametricNDSolveValue to get the solution xtraj2 parametrized by n:

xtraj2 = ParametricNDSolveValue[{D[x[t], t] == Sinh[2 x[t] (t - 2)]/ Cosh[2 x[t] (t - 2)], 
   x[0] == n}, x, {t, 0, 4}, {n}];

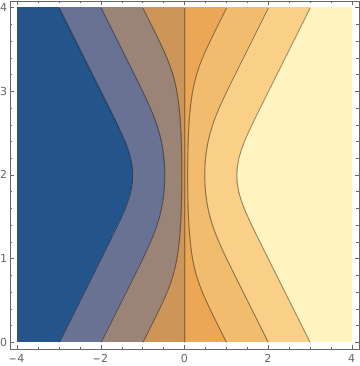
ListContourPlot[Join @@ Table[{xtraj2[n][t], t, n}, {n, -4, 4, .1}, {t, 0, 4, .1}], 
  Contours -> Range[-3, 3]]

enter image description here

Alternatively, you can get an InterpolatingFunction from a table of data generated using pf

if = Interpolation[Join @@ Table[{{xtraj2[n][t], t}, n}, {t, 0, 4, .005}, 
  {n, -4, 4, 1}], InterpolationOrder -> 1];

and use it with ContourPlot or DensityPlot:

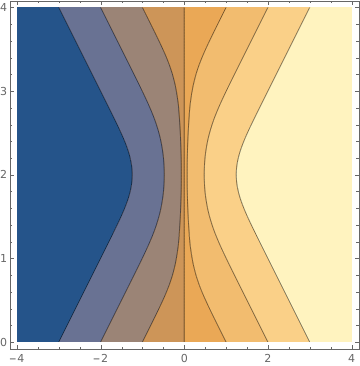
ContourPlot[if[x, y], {x, -4, 4}, {y, 0, 4},  Contours -> Range[-3, 3]]

enter image description here

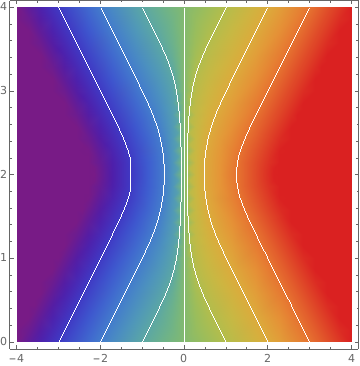
DensityPlot[if[x, y], {x, -4, 4}, {y, 0, 4}, 
  MeshFunctions->{if[#, #2]&}, Mesh -> {Range[-3, 3]}, MeshStyle -> White,
  ColorFunction->"Rainbow", PerformanceGoal->"Quality"]

enter image description here

$\endgroup$
2
  • $\begingroup$ I am using the NDSolve Value to find the value of xtraj[t], I do not want the value of NDSolve, yet here all the plots are plotting the value of NDSolve instead of xtraj[t]. In this instance, it looks the same but if I vary the function it will not. $\endgroup$
    – Betty
    Commented May 30, 2018 at 1:03
  • $\begingroup$ @Betty, not sure i understand your comment. $\endgroup$
    – kglr
    Commented May 30, 2018 at 5:52

Your Answer

By clicking “Post Your Answer”, you agree to our terms of service and acknowledge you have read our privacy policy.

Not the answer you're looking for? Browse other questions tagged or ask your own question.