added density plot
Source Link
bbgodfrey
  • 62.1k
  • 18
  • 92
  • 160

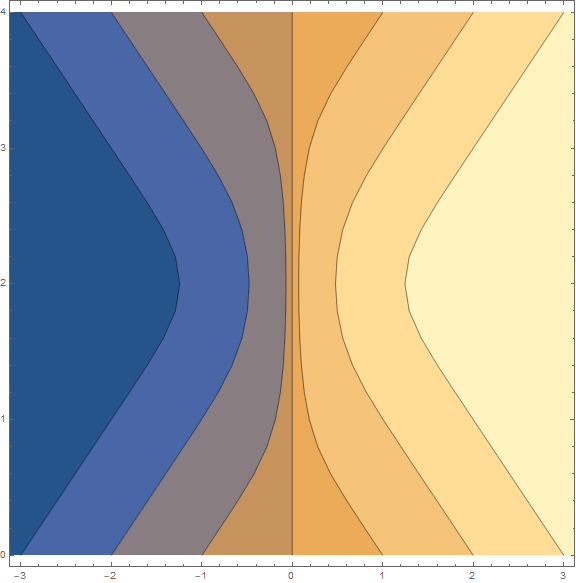
For a contour plot use,

ListContourPlot[Flatten[Table[
    s = NDSolveValue[{D[xtraj[t], t] == 
        (Sinh[2 xtraj[t] (t - 2)])/(Cosh[2 xtraj[t] (t - 2)]), 
        xtraj[0] == n}, xtraj, {t, 0, 4}];
    Table[{s[t], t, n}, {t, 0, 4, .2}], {n, -3.2, 3.2, .2}], 1], 
 Contours -> Range[-4, 4], ImageSize -> Large, PlotRange -> {{-3, 3}, Automatic}],
 AspectRatio -> 2/3, ColorFunction -> "Rainbow"]

enter image description here

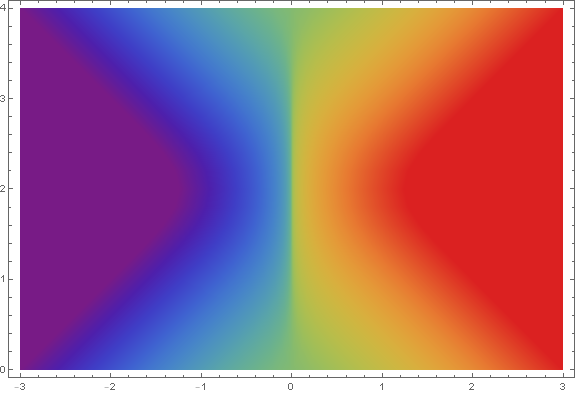
The code for a density plot is similar.

ListDensityPlot[Flatten[Table[
    s = NDSolveValue[{D[xtraj[t], t] == 
        (Sinh[2 xtraj[t] (t - 2)])/(Cosh[2 xtraj[t] (t - 2)]), 
        xtraj[0] == n}, xtraj, {t, 0, 4}];
    Table[{s[t], t, n}, {t, 0, 4, .2}], {n, -3, 3, .2}], 1], 
ImageSize -> Large, AspectRatio -> 2/3, ColorFunction -> "Rainbow"]

enter image description hereenter image description here

For a contour plot use,

ListContourPlot[Flatten[Table[
    s = NDSolveValue[{D[xtraj[t], t] == 
        (Sinh[2 xtraj[t] (t - 2)])/(Cosh[2 xtraj[t] (t - 2)]), 
        xtraj[0] == n}, xtraj, {t, 0, 4}];
    Table[{s[t], t, n}, {t, 0, 4, .2}], {n, -3.2, 3.2, .2}], 1], 
 Contours -> Range[-4, 4], ImageSize -> Large, PlotRange -> {{-3, 3}, Automatic}]

The code for a density plot is similar.

enter image description here

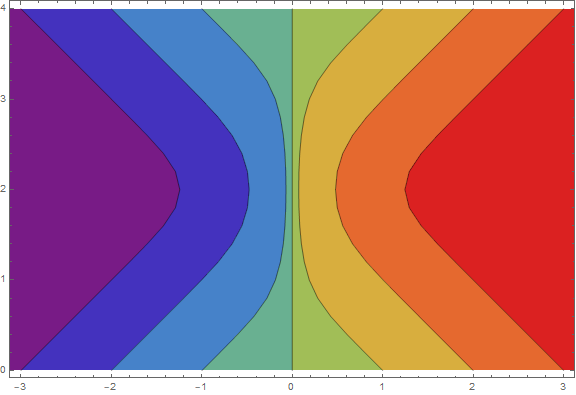
For a contour plot use,

ListContourPlot[Flatten[Table[
    s = NDSolveValue[{D[xtraj[t], t] == 
        (Sinh[2 xtraj[t] (t - 2)])/(Cosh[2 xtraj[t] (t - 2)]), 
        xtraj[0] == n}, xtraj, {t, 0, 4}];
    Table[{s[t], t, n}, {t, 0, 4, .2}], {n, -3.2, 3.2, .2}], 1], 
 Contours -> Range[-4, 4], ImageSize -> Large, PlotRange -> {{-3, 3}, Automatic},
 AspectRatio -> 2/3, ColorFunction -> "Rainbow"]

enter image description here

The code for a density plot is similar.

ListDensityPlot[Flatten[Table[
    s = NDSolveValue[{D[xtraj[t], t] == 
        (Sinh[2 xtraj[t] (t - 2)])/(Cosh[2 xtraj[t] (t - 2)]), 
        xtraj[0] == n}, xtraj, {t, 0, 4}];
    Table[{s[t], t, n}, {t, 0, 4, .2}], {n, -3, 3, .2}], 1], 
ImageSize -> Large, AspectRatio -> 2/3, ColorFunction -> "Rainbow"]
enter image description here

Source Link
bbgodfrey
  • 62.1k
  • 18
  • 92
  • 160

For a contour plot use,

ListContourPlot[Flatten[Table[
    s = NDSolveValue[{D[xtraj[t], t] == 
        (Sinh[2 xtraj[t] (t - 2)])/(Cosh[2 xtraj[t] (t - 2)]), 
        xtraj[0] == n}, xtraj, {t, 0, 4}];
    Table[{s[t], t, n}, {t, 0, 4, .2}], {n, -3.2, 3.2, .2}], 1], 
 Contours -> Range[-4, 4], ImageSize -> Large, PlotRange -> {{-3, 3}, Automatic}]

The code for a density plot is similar.

enter image description here