I've been trying to solve the following differential equation: \begin{equation}\left( \frac{d \tau}{d \sigma} \right)^2 = \frac{(E_0 \cosh\sigma-p_\tau\sinh\sigma)^2}{(E_0 \cosh\sigma-p_\tau\sinh\sigma)^2-M^2}\end{equation} For different values of the constants $E_0, M \text{ and } p_\tau$.
For $E_0$, I managed to a figure that resembles two hyperbolas, I probably have to tweak $p_\tau$ to get the full figure.
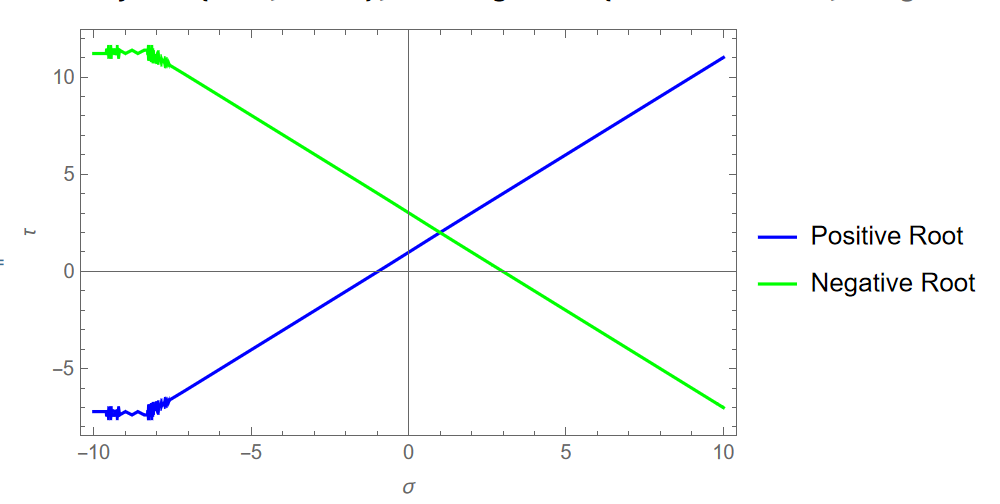
However, when dealing with $E_0 \neq 0$, things get trickier, particularly for negative values of $\sigma$, I get this:

The code I implemented was
E0 = 5;
M = 1;
p = 1;

(*Plus or minus roots after removing the square*)
pode = \[Tau]'[\[Sigma]] == (E0*Cosh[\[Sigma]] - p*Sinh[\[Sigma]])/
    Sqrt[((E0*Cosh[\[Sigma]] - p*Sinh[\[Sigma]])^2 - M^2)];
node = \[Tau]'[\[Sigma]] == -(E0*Cosh[\[Sigma]] - p*Sinh[\[Sigma]])/
    Sqrt[((E0*Cosh[\[Sigma]] - p*Sinh[\[Sigma]])^2 - M^2)];

ic1 = \[Tau][1] == 2;

psol = DSolve[{pode, ic1}, \[Tau], \[Sigma]]
nsol = DSolve[{node, ic1}, \[Tau], \[Sigma]]

psolution = Re[\[Tau][\[Sigma]] /. psol]
nsolution = Re[\[Tau][\[Sigma]] /. nsol]
I chose to leave the square roots and solve for two ODE's, instead of just 1 with squared, because the solution yields many branches, and only some of them are physically significant, so I wanted to analyze the branches this way.
And finally for the plot
Plot[{psolution, nsolution}, {\[Sigma], -10, 10},
FrameLabel -> {"\[Sigma]", "\[Tau]"}, Frame -> True,
PlotStyle -> {Blue, Green},
PlotLegends -> {"Positive Root", "Negative Root"}]
Thank you for the help.
