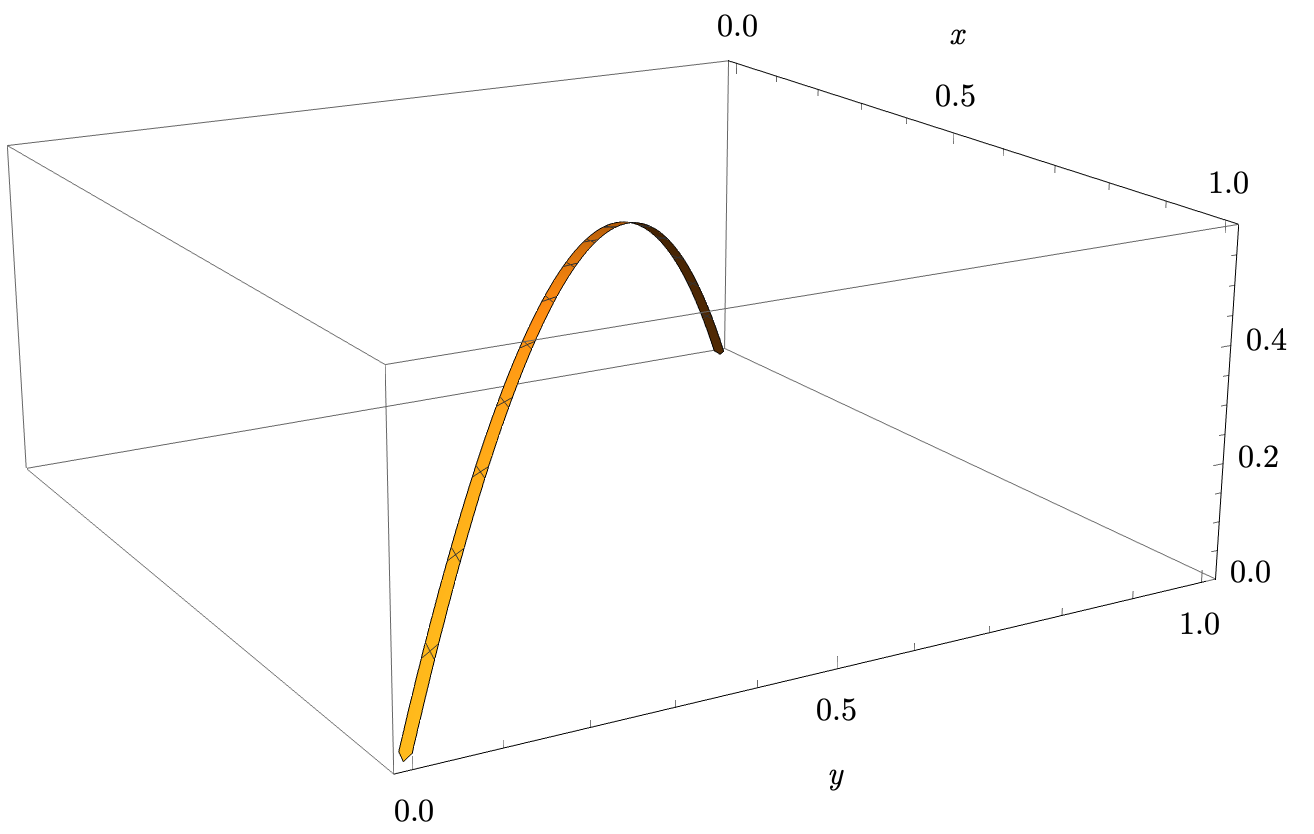
Let's say I have a function $F(q,p)$ and I want to plot the function in 3D view for $p$ and $q$ where $p+q=1$ As you probably notice that $p$ and $q$ are the probability of occurring/not occurring for an event.
I tried the following:
 f = (p^2 (0.25 - 0.375 q) - 0.5 (1. - 1. q)^2 q +
 p (-1. + 0.875 q + 0.125 q^2))/(p (-1. + q) (1.5 + 1. q))
 Plot3D[f, {p, 0, 1}, {q, 0, 1},RegionFunction -> Function[{p, q}, p + q = 1]]
Which gave me the plot for all $p,q \in [0,1]$ and this is not the thing I wanted. I tried to set the constraint to zero, where no values satisfy this except for zeros. But I also gave me the same thing.
I also tried
Plot3D[ConditionalExpression[f, p + q = 1], {p, 0, 1}, {q, 0, 1}, BoundaryStyle -> Directive[Thick, Red], Mesh -> None]
But it gave me an empty graph.


p+q==1(cant say if it will work tho) $\endgroup$f[p_,q_]:=p^2+q^2; Plot3D[f[p,q],{p,0,1},{q 0,1},RegionFunction->Function[{p,q}, .93<p+q<1]]shows a plot, but if you change that .93 to .94 or if you change to p+q==1 the the plot appears empty.. $\endgroup$Grapics3D[Line@Table[{p,1-p,f/.q->1-p},{p,0,1,0.01}]]$\endgroup$