2
$\begingroup$

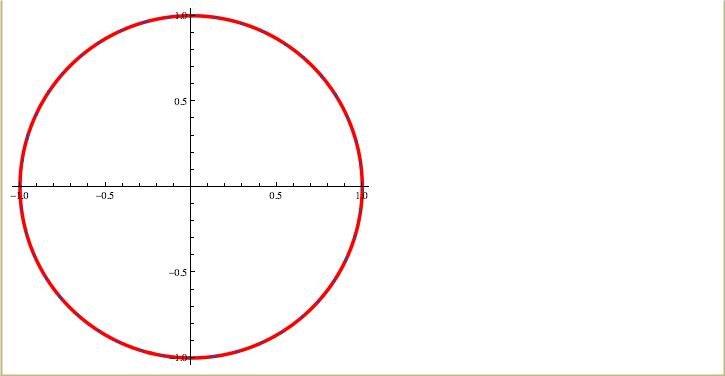
I am making a discrete plot and a regular function plot together. But my curve is so thick that for color-blind people, it's pretty much impossible to see the black dots of my discrete plot:

plot1 = ParametricPlot[{Sin[t], Cos[ t]}, {t, 0, 2 Pi}, 
   PlotStyle -> {Red, Thickness[0.01]}];

plot2 = ListPlot[Table[{Sin[n], Cos[n]}, {n, 50}], 
   PlotRange -> {-1, 1}];

Show[plot1, plot2]

combined plot

I tried adding "thickness" parameter, but it didn't work.

$\endgroup$
5
  • $\begingroup$ Look up PlotMarkers in the documentation. You can set the size and shape and also use a graphics primitive. See this for more: mathematica.stackexchange.com/q/2214/5 $\endgroup$
    – rm -rf
    Commented Oct 4, 2012 at 4:38
  • $\begingroup$ @rm-rf We are starting to answer in comments. This is crazy. We should set up a policy. $\endgroup$ Commented Oct 4, 2012 at 4:48
  • $\begingroup$ @rm-rf, okay I tried doing ListPlot[Table[{Cos[n], Sin[ n]}, {n, 50}], PlotMarkers -> {Table[{Cos[n], Sin[ n]}, {n, 50}], Large}] but it isn't giving me dots. So I switched to "PlotMarkers -> Automatic" and it worked! But I seem to have no control over the size $\endgroup$
    – Lemon
    Commented Oct 4, 2012 at 4:55
  • $\begingroup$ @belisarius I just left a hint for some of the newer users to attempt answering (or for OP himself to read up on the docs and answer)... not for Mr.Wizard. $\endgroup$
    – rm -rf
    Commented Oct 4, 2012 at 5:23
  • $\begingroup$ @rm-rf :))))))) $\endgroup$ Commented Oct 4, 2012 at 5:41

3 Answers 3

3
$\begingroup$

I recommend using Graphics primitives for this kind of application, which gives you direct (and usually easier) control of appearance. As a bonus performance is usually better as well.

For simple applications such as this, if you don't also need the plots separately, you can use Epilog in ParametricPlot to insert these primitives:

ParametricPlot[{Sin[t], Cos[t]}, {t, 0, 2 Pi}, 
  PlotStyle -> {Red, Thickness[0.01]}, 
  Epilog -> {PointSize[Large], Point@Table[{Sin[n], Cos[n]}, {n, 50}]}
]
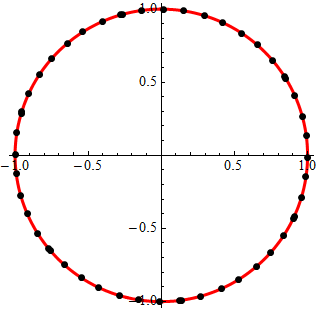
Mathematica graphics

See documentation for PointSize and AbsolutePointSize for complete control of point size.

If you need the plots separately you can do that too, like this:

p1 = ParametricPlot[{Sin[t], Cos[t]}, {t, 0, 2 Pi}, 
       PlotStyle -> {Red, Thickness[0.01]}
     ];

p2 = Graphics[
       {PointSize[Large], Point @ Table[{Sin[n], Cos[n]}, {n, 50}]},
       PlotRange -> {-1, 1}
     ];

Show[p1, p2]

In a comment J. M. reminds us that this form for p2 also works:

p2 = ListPlot[Table[{Sin[n], Cos[n]}, {n, 50}], PlotStyle -> {Black, PointSize[Large]}];

My recommendation to use graphics primitives is so that more complicated styles are within reach and so that code may be shared between Graphics and Epilog. Perhaps I am complicating things for such a simple operation and you would prefer that.

$\endgroup$
8
  • $\begingroup$ That's interesting. I just opened up the Epilog page on Mathematica. I have no idea what it says nor do I think the command explanation tells me anyway that it plots dots for me. $\endgroup$
    – Lemon
    Commented Oct 4, 2012 at 4:58
  • $\begingroup$ @jak You must understand Graphics, PointSize, and Point as well. Epilog allows you to overlay primitives such as Point on top of the result of ParametricPlot. See this documentation and ask for clarifications where you have trouble. $\endgroup$
    – Mr.Wizard
    Commented Oct 4, 2012 at 5:01
  • $\begingroup$ Yeah I definitely will. Thank you $\endgroup$
    – Lemon
    Commented Oct 4, 2012 at 5:04
  • $\begingroup$ @jak, thanks for Accepting my answer (green check-mark), but please consider waiting 24 hours. This gives other people a chance to answer before the topic appears concluded. $\endgroup$
    – Mr.Wizard
    Commented Oct 4, 2012 at 5:07
  • 1
    $\begingroup$ I prefer the Epilog route, but for the second method, having p2 = ListPlot[Table[{Sin[n], Cos[n]}, {n, 50}], PlotStyle -> PointSize[Large]] works just as well. $\endgroup$ Commented Oct 4, 2012 at 9:39
1
$\begingroup$
Clear["Global`*"]
ParametricPlot[{Sin[t], Cos[t]}
 , {t, 0, 2 Pi}
 , PlotStyle -> Directive @@ {Red, AbsoluteThickness[6]}
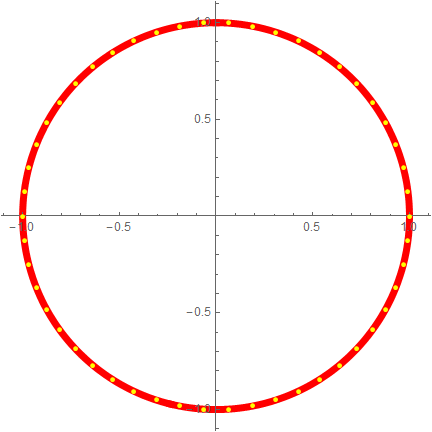
 , Epilog -> {AbsolutePointSize[4], Yellow
   , Point@CirclePoints[50]}
 ]

enter image description here


  1. I will interpret the {n, 50} as equally spaced points around the circle for which CirclePoints is custom designed.

  2. Contrasting colors are perceived more easily.

  3. Using Epilog and Absolute* directives adjust the appearance precisely as suggested in comments.

$\endgroup$
1
$\begingroup$

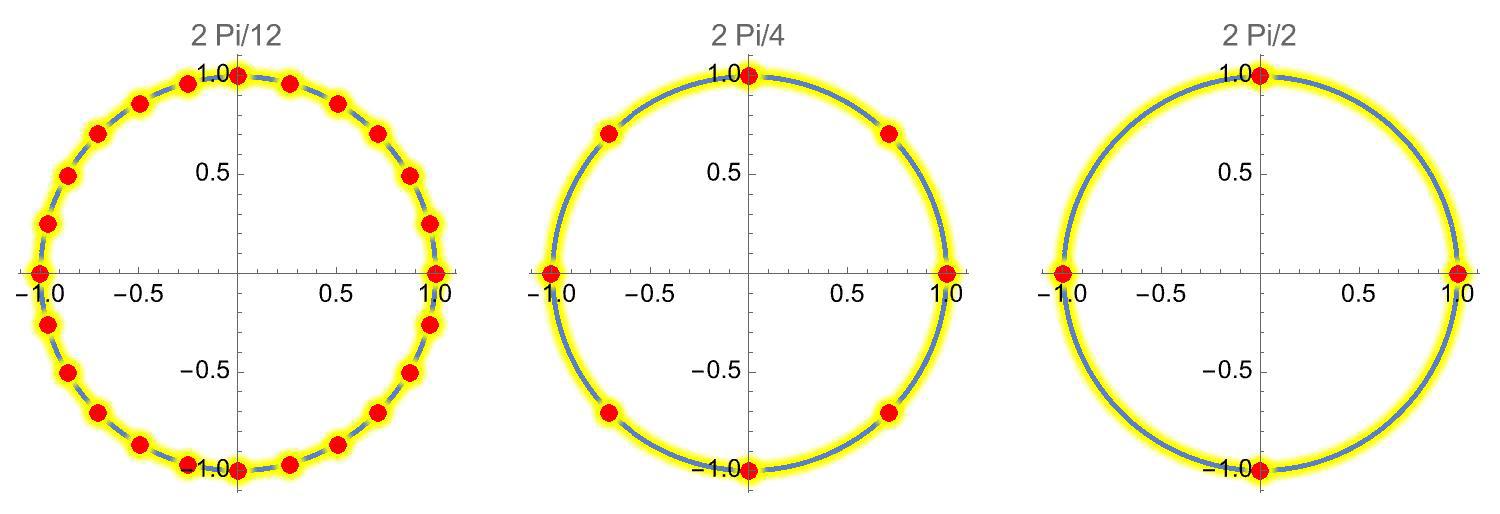
Using Haloing (new in 13.3)

GraphicsGrid[{
  ParametricPlot[{Sin[t], Cos[t]}, {t, 0, 2 Pi},
     Mesh -> {Range[0, 2 Pi, Pi/#]},
     MeshStyle -> Directive[Red, PointSize[Large]],
     PlotLabel -> "2 Pi/" <> ToString[#],
     PlotStyle -> Haloing[Yellow, 0, 4]] & /@ {12, 4, 2}}]

enter image description here

$\endgroup$

Your Answer

By clicking “Post Your Answer”, you agree to our terms of service and acknowledge you have read our privacy policy.

Not the answer you're looking for? Browse other questions tagged or ask your own question.