0
$\begingroup$
 xaxisb2 = {0.1, 0.2, 0.25, 0.3, 0.5, 0.7, 0.75, 0.8, 0.9};
yaxisbc2 = {1617, 1631, 1637, 1644, 1685, 1774, 1808, 1849, 1955};
 yaxisbs2 = {1696, 1714, 1723, 1732, 1781.261406069227`, 1877, 1913, 
 1955, 2065};
ystnew = Reverse[yaxisbs2];
 ychnew = Reverse[yaxisbc2];
 Datachb2 = Transpose@{1 - xaxisb2, yaxisbc2};
  Datastb2 = Transpose@{1 - xaxisb2, yaxisbs2};
  ListPlot[{Datachb2, Datastb2}, Frame -> True, 
 FrameLabel -> {" h", 
   "\!\(\*OverscriptBox[SubscriptBox[\(T\), \(c\)], \(_\)]\)"}, 
   FrameStyle -> Thickness[.003], FrameTicks -> Automatic, 
   LabelStyle -> Directive[Black, Bold, Medium], 
  PlotStyle -> {Darker[Green], Blue}, 
  PlotRange -> {{0, 1}, {1500, 2200}}, 
   PlotMarkers -> {{"\[EmptyDiamond]", 14}, "\[FilledCircle]"}]

Here is my code. I want to make the border of the open diamond thick. Please suggest how to do that.

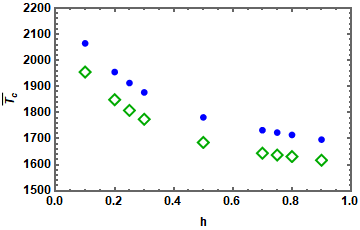
$\endgroup$
6
  • $\begingroup$ What do you mean by 'open symbol' ? If you need the frame to be thicker , use FrameStyle -> AbsoluteThickness[2] $\endgroup$
    – flinty
    Commented Apr 22, 2021 at 18:09
  • $\begingroup$ I mean I want in the plotmarker the border of the empty diamond to be thick. $\endgroup$ Commented Apr 22, 2021 at 18:18
  • 3
    $\begingroup$ PlotMarkers -> {Charting`CommonDump`GraphicsOpenPlotMarkersThick[][[3]], "\[FilledCircle]"}, which is where you'll find the markers for the option PlotMarkers -> "OpenMarkersThick". $\endgroup$
    – Michael E2
    Commented Apr 22, 2021 at 19:35
  • 1
    $\begingroup$ Or from this answer, PlotMarkers -> {Graphics[{Dynamic@EdgeForm@Directive[CurrentValue["Color"], JoinForm["Round"], AbsoluteThickness[2], Opacity[1]], FaceForm[White], ResourceFunction["PolygonMarker"]["Diamond", Offset[6]]}, AlignmentPoint -> {0, 0}], "\[FilledCircle]"} $\endgroup$
    – Michael E2
    Commented Apr 22, 2021 at 20:15
  • $\begingroup$ Thanks a lot, @Michael E2. $\endgroup$ Commented Apr 23, 2021 at 2:36

1 Answer 1

2
$\begingroup$

You could create markers with Graphics instead:

xaxisb2 = {0.1, 0.2, 0.25, 0.3, 0.5, 0.7, 0.75, 0.8, 0.9};
yaxisbc2 = {1617, 1631, 1637, 1644, 1685, 1774, 1808, 1849, 1955};
 yaxisbs2 = {1696, 1714, 1723, 1732, 1781.261406069227`, 1877, 1913, 
    1955, 2065};
ystnew = Reverse[yaxisbs2];
 ychnew = Reverse[yaxisbc2];
 Datachb2 = Transpose@{1 - xaxisb2, yaxisbc2};
  Datastb2 = Transpose@{1 - xaxisb2, yaxisbs2};
  ListPlot[{Datachb2, Datastb2}, Frame -> True, 
  FrameLabel -> {" h", 
      "\!\(\*OverscriptBox[SubscriptBox[\(T\), \(c\)], \(_\)]\)"}, 
    FrameStyle -> AbsoluteThickness[2], FrameTicks -> Automatic, 
    LabelStyle -> Directive[Black, Bold, Medium], 
   PlotRange -> {{0, 1}, {1500, 2200}}, 
    PlotMarkers -> {
   {Graphics[{EdgeForm[{Thick, Darker[Green]}], FaceForm[None], Rotate[RegularPolygon[4], 45 Degree]}], 14},
    {Graphics[{Blue, Disk[]}], 8}}]

plot with markers

$\endgroup$

Your Answer

By clicking “Post Your Answer”, you agree to our terms of service and acknowledge you have read our privacy policy.

Not the answer you're looking for? Browse other questions tagged or ask your own question.