I want to plot the function $y=2^x$ at the $x$-values given by Table[Prime[n], {n,20}]
How should I write the plot function? Like so?
list = Table[Prime[n], {n,20}]
Plot[y = 2^x, Evaluate[list]]
All the solutions so far have plotted {n, 2^Prime[n]} for integer values of n, which means that the points will be evenly spaced along the horizontal axis. Here's how to do what was actually asked, plotting {x, 2^x} for prime values of x.
Since 2^x grows so quickly, I'll demonstrate instead with Sqrt[x] so that it's easier to see the uneven distribution of primes along the horizontal axis.
Using ListPlot, you want to specify the horizontal position using {x,y} pairs, rather than just a list of heights:
primes = Table[Prime[n], {n, 20}];
ListPlot[Table[{x, Sqrt[x]}, {x, primes}]]

Using DiscretePlot, you want to provide the horizontal positions using the {x, {x1, x2, ..., xn}} variable specification:
primes = Table[Prime[n], {n, 20}];
DiscretePlot[Sqrt[x], {x, primes}]

Alternatively, you can use a function dedicated to plotting discrete data:
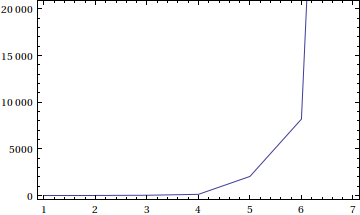
DiscretePlot[2^Prime[n], {n, 1, 7}, Filling -> None, Frame -> True, Joined -> True]

x = Table[Prime[n], {n, 20}];
y = 2^x;
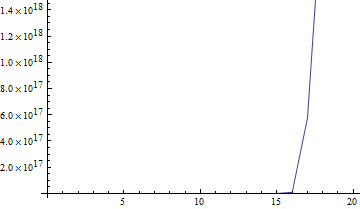
ListLinePlot[y]
Exponential functions increase too fast:
ListPlot[2^Table[Prime[n], {n, 20}], Joined -> True]

Instead, it is better to work with ListLogPlot (plotting a given function in the logarithmic scale) or just DiscretePlot of the Log :
GraphicsRow[
    { ListLogPlot[2^Table[Prime[n], {n, 20}], Joined -> True, PlotStyle -> Thick],
      DiscretePlot[Log[2^Prime[n]], {n, 20},  PlotMarkers -> {Automatic, Medium}]}]

Joined->Trueor ListLinePlot. $\endgroup$Plot. You simply need a function, and then the variable range in the form{x,xmin,xmax}. $\endgroup$