7
$\begingroup$

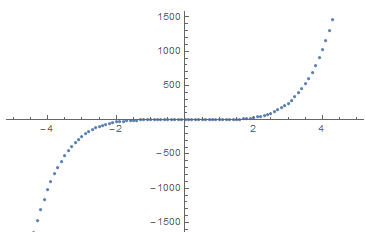
Often, I'll have a list of pairs I want to plot, that goes over some broad range. For example:

a = Table[{x, x^5}, {x, -5, 5, .1}];
ListPlot[a]

enter image description here

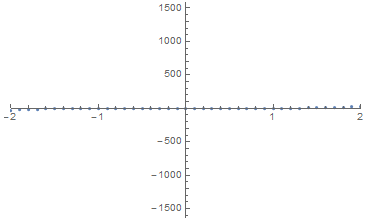
However, I'll really only want to plot a subset of those points, knowing the sub-domain (i.e., x values, in this case, -2 to 2) I want to plot, but not the range of that sub-domain (the y values). Similarly, I want ListPlot to automatically scale the vertical axis, within this subset. However, if I do:

ListPlot[a, PlotRange -> {{-2, 2}, Automatic}]

I get:

enter image description here

So it's obviously just using the auto range for the full data set still. This makes some sense, because technically I'm still passing it the whole set. So I know one solution is to first cleanse that data set. But at this point it seems like ListPlot could also figure out the points I actually want plotted. Is there a way to make it do this?

$\endgroup$
2
  • 1
    $\begingroup$ Perhaps ListPlot@Select[a, -2 < #[[1]] < 2 &] $\endgroup$
    – Alan
    Commented Jun 2, 2017 at 18:25
  • $\begingroup$ @Alan thanks, but that's what I mean by pre-cleansing the data. I'm currently doing that with a fairly small function I made, but I'm wondering if there's a way to do that just in ListPlot. $\endgroup$ Commented Jun 2, 2017 at 18:58

3 Answers 3

3
$\begingroup$

A bit awkward, but it works and (as requested) all processing is within the ListPlot call:

a = Table[{x, x^5}, {x, -5, 5, .1}];
ListPlot[a,
 PlotRange -> {myrange = {-2, 2}, 
     {Min[q = Select[a, myrange[[1]] < #[[1]] < myrange[[2]] &][[All, 2]]], Max[q]}}]

Frankly, though, I don't see why it would ever be preferable to do the processing and selection within the ListPlot function call, since eliminating the unneeded data points before the call will always be more efficient.

$\endgroup$
3
$\begingroup$
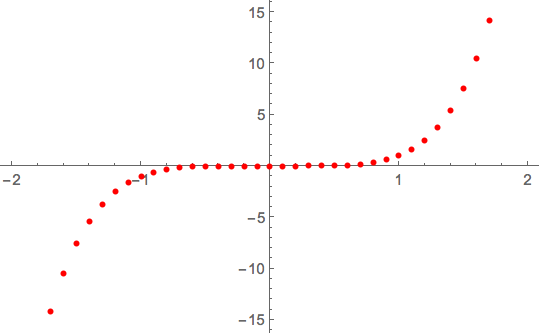
a = Table[{x, x^5}, {x, -5, 5, .1}];

Plot[Interpolation[a][x], {x, -2, 2}, PlotStyle -> Opacity[0],
 Epilog -> {Red, AbsolutePointSize[4], Point[a]}]

enter image description here

Or to show all of the points in the range {-2, 2}

Plot[Interpolation[a][x], {x, -2, 2}, PlotStyle -> Opacity[0], 
 PlotRange -> All, Epilog -> {Red, AbsolutePointSize[4], Point[a]}]
$\endgroup$
0
$\begingroup$

Two ways to use Interpolation:

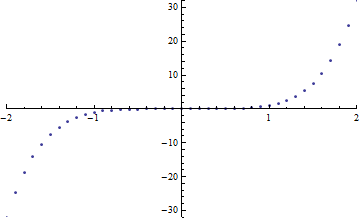
Use it to specify the second part of PlotRange setting:

ListPlot[a, PlotRange -> {{-2, 2}, Interpolation[a] /@ {-2, 2}}]

Mathematica graphics

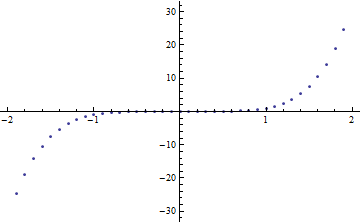
Or, a variation of @BobHanlon's approach using Mesh:

Plot[Interpolation[a]@x, {x, -2, 2}, PlotRange -> Full,
 Mesh -> {a[[All, 1]]},  MeshShading -> {None, None}]

Mathematica graphics

$\endgroup$

Your Answer

By clicking “Post Your Answer”, you agree to our terms of service and acknowledge you have read our privacy policy.

Not the answer you're looking for? Browse other questions tagged or ask your own question.