1
$\begingroup$

Consider the following test function:

func[x_] = x^3 Exp[-x^2];

In general, it may be an arbitrary function without e.g. extrema.

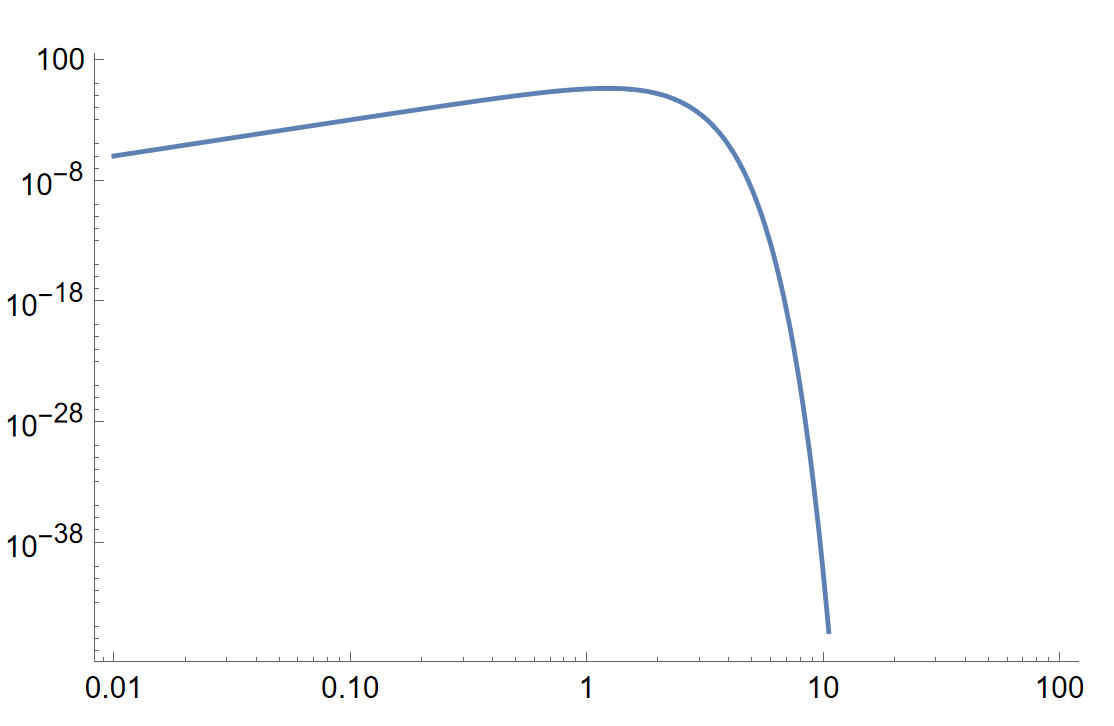
I want to plot it:

LogLogPlot[func[x], {x, 0.01, 100}]

enter image description here

Due to the exponential decrease, the automatic PlotRange is down to a very small values.

I want to cut it from below by say 10^-15, but also to adjust the maximal value such that it would correspond to say 1.5*Max[func[x]]. The only thing I know is to use PlotRange:

LogLogPlot[func[x], {x, 0.01, 100}, PlotRange -> {All, {10^-15, 2}}]

However, the second argument in {10^-15,2} is added by hand. Could you please tell me whether it is possible to make its evaluation automatic depending on the needs?

$\endgroup$
2
  • 1
    $\begingroup$ Not sure how you chose $10^{-15}$ so I don't know how to do that algorithmically, but for the other end you could perhaps use NMaxValue[func[x], x] and an appropriate multiplier. $\endgroup$
    – MarcoB
    Commented Jun 2, 2023 at 13:18
  • 1
    $\begingroup$ How should MMA know what your needs are? $\endgroup$ Commented Jun 2, 2023 at 14:28

1 Answer 1

2
$\begingroup$

You could make a function to calculate the vertical bounds of the plot that takes the function as input and calculates the min and max of the function over the range {0.01, 100}. If the min is less than 10^-15, replace it with 10^-15. If you want to calculate the bounds for ranges other than {0.01,100}, you could make those inputs to the function as well:

func[x_] = x^3 Exp[-x^2];
yBounds[f_] := {1.5*MaxValue[{f[x], 0.01 <= x <= 100}, x], 
  Max[MinValue[{f[x], 0.01 <= x <= 100}, x], 10^-15]}
LogLogPlot[func[x], {x, 0.01, 100}, PlotRange -> {All, yBounds[func]}]
$\endgroup$

Your Answer

By clicking “Post Your Answer”, you agree to our terms of service and acknowledge you have read our privacy policy.

Not the answer you're looking for? Browse other questions tagged or ask your own question.