3
$\begingroup$

I have this code

 ParametricPlot3D[{(Sin[t]/30), (Cos[t]/30), 0}, {t, 0, (2 π)}, 
   PlotRange -> Automatic]

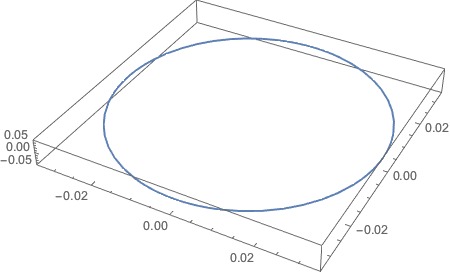
the output (below) shows that the options Automatic is not adjusting the z axis to better visualize the circle. How can I solve this? The same thing happens when I put PlotRange -> All or PlotRange -> Full. I am doing a list with thousands of tinny plots around the origin, so manual setting the PlotRange is not an option to me.

enter image description here

$\endgroup$
1
  • $\begingroup$ You should look at the BoxRatios option. $\endgroup$
    – m_goldberg
    Commented Apr 17, 2017 at 15:36

1 Answer 1

2
$\begingroup$

Is this closer to what you want?

ParametricPlot3D[{(Sin[t]/30), (Cos[t]/30), 0}, {t, 0, (2 π)}, 
  PlotRange -> {Automatic, Automatic, {-.05, .05}},
  BoxRatios -> {1, 1, 0.1}]

plot

$\endgroup$
3
  • $\begingroup$ BoxRatios -> {1, 1, 0.1} alone would work too, you don't really need to set PlotRange, right? $\endgroup$
    – BlacKow
    Commented Apr 17, 2017 at 17:34
  • $\begingroup$ Thank you Blackow! BoxRatios solve the problem. $\endgroup$ Commented Apr 17, 2017 at 19:16
  • $\begingroup$ @BlacKow. The reason for adding the PlotRange option is to get readable labels on the z-axis. $\endgroup$
    – m_goldberg
    Commented Apr 19, 2017 at 0:06

Your Answer

By clicking “Post Your Answer”, you agree to our terms of service and acknowledge you have read our privacy policy.

Not the answer you're looking for? Browse other questions tagged or ask your own question.