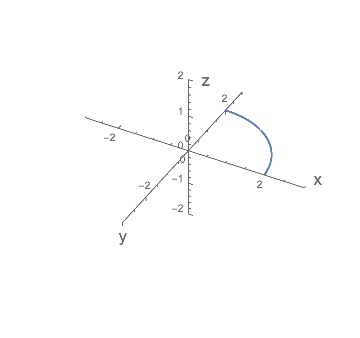
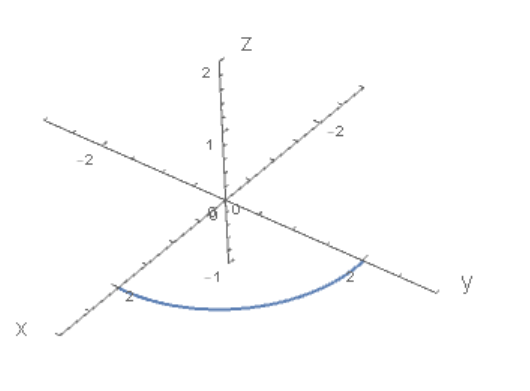
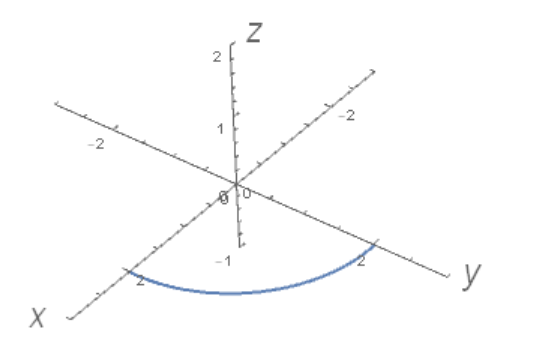
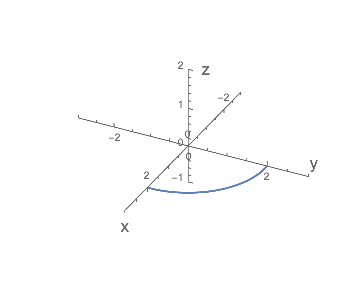
As the output of the following code shows, by default Mathematica does not necessarily place the axes label for 3D graphics at the positive ends of the axes, for axes emanating from the origin.
In the graphical output, the y-axis label is at the negative end, contrary to the way a mathematician would ordinarily label such a figure.
Is there some option to have the labels put at the positive ends?
 ParametricPlot3D[{2 Cos[θ], 2 Sin[θ], 0}, {θ, 0, π/2},
    PlotStyle -> Thick, PlotRange -> {{-3, 3}, {-3, 3}, {-2, 2}},
    Boxed -> False, AxesOrigin -> {0, 0, 0},
    AxesLabel -> (Style[#, 16] &) /@ {"x", "y", "z"}]


Text. $\endgroup$