5
$\begingroup$

I would like to plot the volume of the following integral:

$$\int _{-1}^1\int _0^{\sqrt{1-y^2}}\int _{x^2+y^2}^{\sqrt{x^2+y^2}}\left(xyz\right)dzdxdy$$

Here are the ranges of the variables from this iterated integral.

$$-1\le y\le 1 $$

$$0 \le x\le \sqrt{1-y^2}$$

$$x^2+y^2\le z\le\sqrt{x^2+y^2}$$

This is the right half of a region which lower bound is an elliptic paraboloid and the upper bound is a cone.

I have no previous experience with Mathematica so I have only managed to plot a elliptic paraboloid and a cone:

ContourPlot3D[{z == x ^2 + y^2, z^2 == x ^2 + y^2}, {x, -2, 2}, {y, -2, 2}, {z, -2, 2}]

I have tried this alternatives but the results are "empty":

RegionPlot3D[x^2 + y^2 <= (x^2 + y^2)^1/2, {x, -1, 1}, {y, -1, 1}, {z, -1, 1}]

Plot3D[{ (x^2 + y^2), (x^2 - y^2)^1/2}, {x, -1, 1}, {y, -1, 1}, RegionFunction -> Function[{x, y}, (x^2 + y^2) < (x^2 - y^2)^1/2]]

RegionPlot3D[ z <= Sqrt[x^2 + y^2] && y^2 + x^2 < 0 && z > 0, {x, -1.5, 1.5}, {y, -2, 2}, {z, -2, 2}, PlotPoints -> 100]

Thanks in advance.

$\endgroup$
0

2 Answers 2

7
$\begingroup$

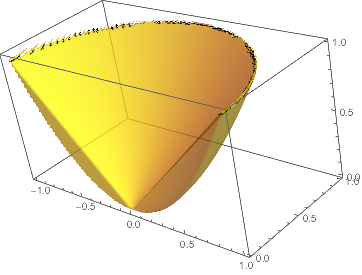
To get the region, you can use region plot, you should take the limits of the integral exactly as they are written and supply them to the function, separating the region corresponding to each integral by the And function(&&). The edge is a little jagged, but you can play with the number of plot points to get a better or worse picture.

RegionPlot3D[
 -1 <= y <= 1 && 0 < x < Sqrt[1 - y^2] && 
  x^2 + y^2 < z < Sqrt[x^2 + y^2]
 , {y, -1, 1}, {x, 0, 1}, {z, 0, 1}
 , PlotPoints -> 100
 , PerformanceGoal -> "Quality"
 , PlotStyle -> Directive[Yellow, Opacity[0.5]], Mesh -> None
 , BoxRatios -> {2, 1, 1}
 ]

enter image description here

$\endgroup$
4
  • 1
    $\begingroup$ Weirdly enough, I obtained a more regular, "prettier" picture using your code as posted (link). Is it possible that the one you posted was obtained using far fewer than 100 points? (+1) $\endgroup$
    – MarcoB
    Commented Aug 24, 2015 at 21:37
  • $\begingroup$ Must have. :/ Fixed. $\endgroup$
    – N.J.Evans
    Commented Aug 25, 2015 at 0:28
  • 1
    $\begingroup$ Have you seen this? $\endgroup$ Commented Aug 28, 2015 at 10:25
  • $\begingroup$ Wow! That's a huge improvement. I'll have to read it closely when I've got the time. $\endgroup$
    – N.J.Evans
    Commented Aug 28, 2015 at 13:30
4
$\begingroup$

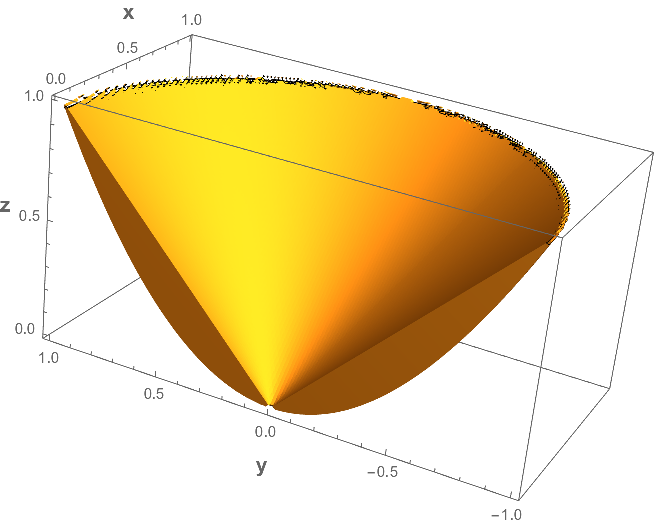
Using ImplicitRegion

rgn = ImplicitRegion[-1 <= y <= 1 && 0 <= x <= Sqrt[1 - y^2] && 
    x^2 + y^2 <= z <= Sqrt[x^2 + y^2], {x, y, z}];

RegionPlot3D[rgn,
 PlotPoints -> 150,
 Axes -> True,
 AxesLabel ->
  (Style[#, Bold, 14] & /@ {"x", "y", "z"})]

enter image description here

The volume is

vol = Volume[rgn]

Pi/12

or alternatively,

vol == RegionMeasure[rgn, 3] ==
 Integrate[1, Element[{x, y, z}, rgn]] ==
 Integrate[1, {y, -1, 1}, {x, 0, Sqrt[1 - y^2]},
  {z, x^2 + y^2, Sqrt[x^2 + y^2]}]

True

Your original integral is

Integrate[x*y*z, Element[{x, y, z}, rgn]]

0

$\endgroup$

Your Answer

By clicking “Post Your Answer”, you agree to our terms of service and acknowledge you have read our privacy policy.

Not the answer you're looking for? Browse other questions tagged or ask your own question.