5
$\begingroup$

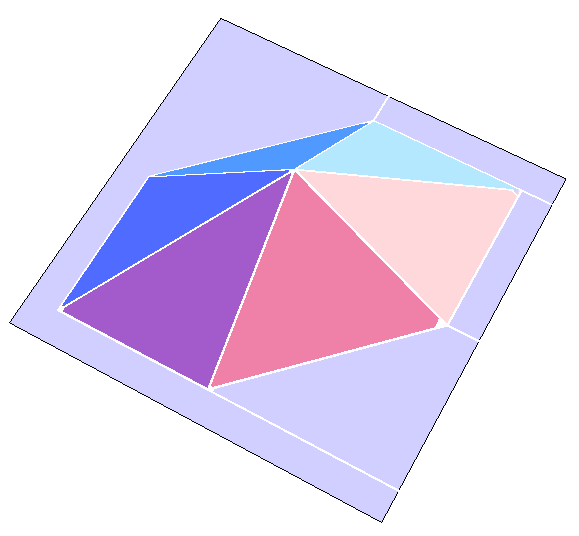
I'm wondering how to plot the boundaries of each piece of a bivariate piecewise function. Lets take for instance the following piecewise linear function $B_{111}(x,y)$:

B11[x_, y_] = Piecewise[{{1, 0 <= x <= 1 && 0 <= y <= 1}}]
B111[x_, y_] = Integrate[B11[x - t, y - t], {t, 0, 1}]

At the moment, I use the following Plot3D command to visualize the function:

Plot3D[B111[x, y], {x, -0.2, 2.2}, {y, -0.2, 2.2}, 
       PlotRange -> Full, PlotPoints -> 25, Axes -> False, 
       Boxed -> False, Mesh -> None]

enter image description here

Although in this particular case the boundaries of the individual pieces are already visible due to low quality plot settings, how can I actively plot these boundaries (i.e. as mesh or wireframe) in the same visualization?

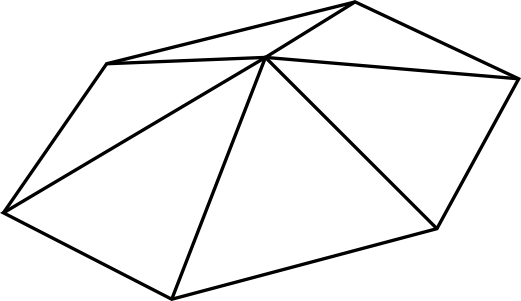
Edit: In this case, it should result in a wireframe consisting of six triangles (and one hexagon):

enter image description here

Additionally, is it possible to add some kind of constraint to the Plot3D function, such that it only visualizes the actual function? In other words, it should exclude the parts where the function is not defined (i.e. outside the support assigned a grey color in the image below).

$\endgroup$
4
  • 1
    $\begingroup$ This is closely related to your earlier question How to display the support supp(f) of a piecewise function z = f(x,y)?. Just use Plot3D[..., Exclusions -> None]]. For a better resolution use higher values of PlotPoints and MaxRecursion, e.g PlotPoints -> 50, MaxRecursion -> 4. $\endgroup$
    – Artes
    Commented Jul 17, 2013 at 15:09
  • $\begingroup$ For the answer look at the updated version of my answer to your first question. $\endgroup$
    – Artes
    Commented Jul 17, 2013 at 15:18
  • $\begingroup$ @Artes Thanks for the update. I just realized that my question is formulated somewhat ambiguously — I'm trying to plot the boundary of every piece of the piecewise function $B_{111}(u,v)$. $\endgroup$
    – Ailurus
    Commented Jul 17, 2013 at 15:29
  • $\begingroup$ by boundaries you mean edges only? $\endgroup$
    – Kuba
    Commented Jul 18, 2013 at 0:36

1 Answer 1

6
$\begingroup$

Response to OP's last edit:

[...] is it possible to add some kind of constraint to the Plot3D function, such that it only visualizes the actual function? [...]

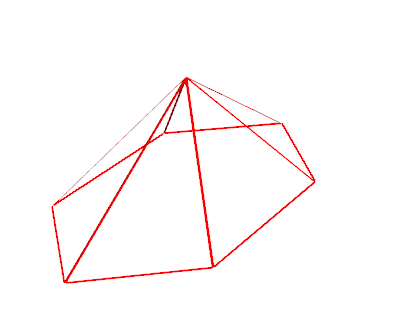
It is visualising actual function. From Piecewise documentation you will get that it is by default set to 0 to other arguments than matched True with conditions. You can set B11[x_, y_] = Piecewise[{{1, 0 <= x <= 1 && 0 <= y <= 1}},None]; but unfortunatell it will get dirty after differentiation.

Lets assume you do not want to know specific coordinates but only plot the wireframe you've described.

I'm going to put with force None to last part of B111. Then we will use BoundaryStyle and ExlusionsStyle to plot the wireframe ;)

 B11[x_, y_] = Piecewise[{{1, 0 <= x <= 1 && 0 <= y <= 1}}];
 B111[x_, y_] = Integrate[B11[x - t, y - t], {t, 0, 1}];

 f[x_, y_] = Piecewise[First[List @@ B111[x, y]], None]

 Plot3D[f[x, y], {x, -0.2, 2.2}, {y, -0.2, 2.2}, Axes -> False, Mesh -> None, 
                 ExclusionsStyle -> Directive[Thick, Red], PlotStyle -> None, 
                 BoundaryStyle -> Directive[Thick, Red], Boxed -> False, 
                 Lighting -> "Neutral", ImageSize -> 500]
enter image description here

Accurate approach

We will take only what we need to. ;)

following function replaces inequalities with equalities and looks for "convex hull" minimal sample of critical points of the region.

In this simple case (triangles) they can be used straightforwardly to create regions. for more complex regions it will require deeper analysis.

pointExtract[cond_] := Module[{ineq = {Less, LessEqual, GreaterEqual, Greater}, temp},
           temp = LogicalExpand@cond; (*<- important part, thanks to halirutan's 
                                        important remarks*)  
           temp = (temp /. {f_[x__, a__] :> Equal[x, a] /; MemberQ[ineq, f],
                            And -> Or}
                  ) /. Or -> List; (*making equalities*)
           temp = Tuples[temp, 2]; (*pairing them to each other*)
           DeleteDuplicates@Cases[{x, y} /. ((Quiet@Solve[#, {x, y}] & /@ temp)),
                                  {_?NumericQ ..}, \[Infinity]] (*solving paired equations*)
                    ]

Now we have to prepare set of inequalities:

eq = (List @@ B111[x, y])[[1, ;; , 2]] /. Or -> Sequence

points = DeleteCases[pointExtract /@ eq, {Repeated[{_, _}, 2]}]; 
(*we only take those with 3 or more points since we are not interested in lines and points*)
Graphics[{Hue@RandomReal[], Polygon[#]} & /@ points] (*domains plot*)

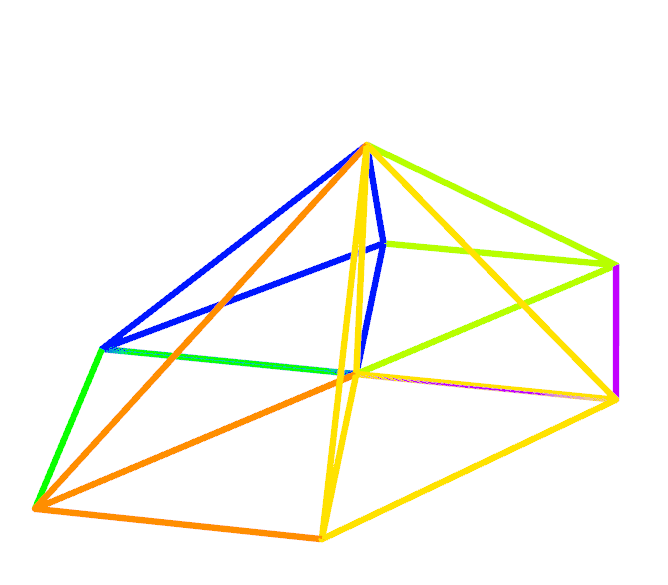
Below I have assumed that additional point is {1, 1, 1} (from B111 form) but it can be easily generalised.

Graphics3D[With[{len = Length@#},
GraphicsComplex[
         ({##, 0} & @@@ #)~Join~{{1, 1, 1}}, 
         {Hue@RandomReal[], [email protected],
          Line[{##, len + 1} & @@@ Partition[{Sequence @@ Range[len], 1}, 2, 1]]}]
               ] & /@ points

          , Boxed -> False]
enter image description here

First, not accurate approach

The question is: how much do you need to know about those borders.

If you just want to plot the regions the following method is simple enough:

eq = (List @@ B111[x, y])[[1, ;; , 2]]

RegionPlot[eq, {x, -.1, 2.2}, {y, -.1, 2.2}, PlotPoints -> 50, PlotStyle -> None,
                                             BoundaryStyle -> Blue]
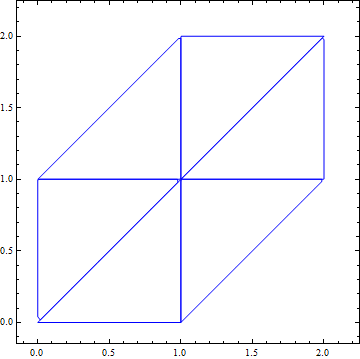
enter image description here

$\endgroup$
12
  • $\begingroup$ +1; I was just about to post something like this. It's worth pointing out that this solution relies on the fact that B111[x, y] is actually a Piecewise function that we can "look inside" (and not something involving Abs or Max or the like). $\endgroup$
    – user484
    Commented Jul 17, 2013 at 20:35
  • $\begingroup$ @RahulNarain Yes, I like it too :). I also like that Mathematica gives us easy access to the data produced inside Plot Piecewise etc. $\endgroup$
    – Kuba
    Commented Jul 18, 2013 at 8:44
  • $\begingroup$ @Kuba Thanks for your solution! This goes way above my knowledge of Mathematica however, so what would I need to change to do the same thing for the function $B_{1111}(u,v)$ defined as B1111[x_, y_] = Integrate[B111[x + t, y - t], {t, 0, 1}]? $\endgroup$
    – Ailurus
    Commented Jul 18, 2013 at 15:11
  • 1
    $\begingroup$ @Ailurus I've made an edit :) tell me if it is what you are looking for. $\endgroup$
    – Kuba
    Commented Jul 18, 2013 at 22:57
  • 1
    $\begingroup$ @Ailurus I will take a closer look later, I do not have time now, sorry. $\endgroup$
    – Kuba
    Commented Jul 19, 2013 at 9:02

Your Answer

By clicking “Post Your Answer”, you agree to our terms of service and acknowledge you have read our privacy policy.

Not the answer you're looking for? Browse other questions tagged or ask your own question.