2
$\begingroup$

I have some data and want to fit it to Planck's law for black body radiation. The problem is that Mathematica does not give me the correct coefficients.

When I evaluate

dati = Import["https://pastebin.com/raw/MGEzkeC3", "Table"];
h = 6.62607004*10^(-34);
c = 299792458;
kb = 1.38064852*10^(-23);
Planks[l_, T_, A_] := (1/A)*(((2*h*c^2)/l^5)*(1/(Exp[((h*c)/(l*kb*T))] - 1)));
fittesana2 = FindFit[dati, Planks[l, T, A], {T, A } , l];
Show[
  Plot[fittesana2[l], {l, 400, 900}, PlotStyle -> Red, PlotRange -> All], 
  ListPlot[dati], Frame -> True]
Pfit = NonlinearModelFit[dati, Planks[l, T, A], {{A, 1*10^8}, {T, 1700}}, l];
Show[
  Plot[Pfit[l], {l, 400, 900}, PlotStyle -> Red, PlotRange -> All],
  ListPlot[dati], Frame -> True]
Normal[Pfit]
Pfit["ANOVATable"]
Pfit["ParameterTable"]
Pfit["FitCurvatureTable"]

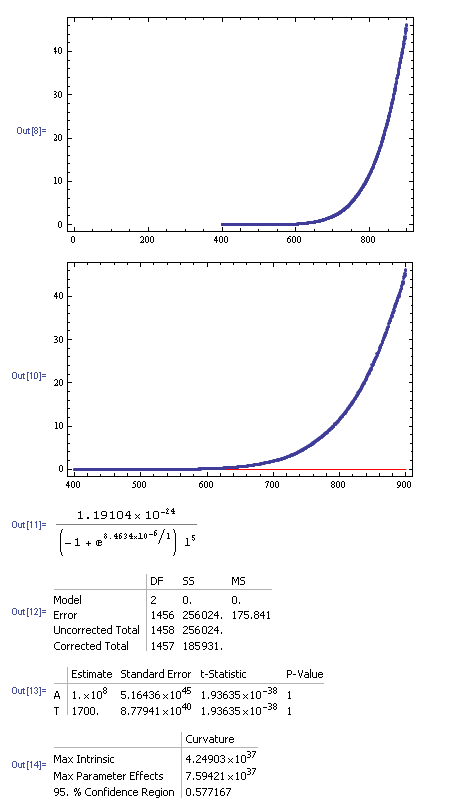
I get

enter image description here

Sorry guys for forgetting to write down constants. And my data is only the part of Black Body radiation law. And unit of x-axis is nanometers(nm), and y-axis (uW/cm^2/nm).
Update: As suggested by @JimB, I changed my fitting function. I tried to use @JimB suggested function, but for me easier was different one, because I need to find out temperature (Te). Here is the code:

h = 6.62607004*10^(-34);
c = 299792458;
kb = 1.38064852*10^(-23);
b = 2*6.62607004*10^(-34)*299792458^2*Pi;
d = (6.62607004*10^(-34)*299792458)/(1.38064852*10^(-23));
dati = ImportString[Import["H2liesma.txt"], "Table"];
Plankulis[la_, Te_, G_, b_, d_] := (1/G)*(b/(la^5*(Exp[d/(la*Te)] - 1)));
Pfit3 = FindFit[dati, 
   Plankulis[la, Te, G, b, d], {G, 1*10^(9)}, { Te, 1500} , la];
Show[Plot[Pfit3[la], {la, 400, 900}, PlotStyle -> Red, 
  PlotRange -> All], ListPlot[dati], Frame -> True]

I get:

  FindFit::nonopt: Options expected (instead of la) beyond position 4 in FindFit[{{400.035,-0.00759963},{400.409,0.0136996},{400.783,-0.000465753},{401.157,0.00636862},{401.531,0.0205706},{401.904,0.0257837},{402.278,0.0298773},{402.652,0.00226108},{403.025,0.0188769},{403.399,-0.0230916},{403.772,-0.00365794},{404.146,0.00856837},<<28>>,{414.961,-0.00272152},{415.333,-0.00222349},{415.706,-0.00943255},{416.078,-0.00921836},{416.45,0.00204648},{416.823,-0.0261218},{417.195,-0.00775242},{417.567,0.0140285},{417.939,-0.00992257},{418.311,-0.00711655},<<1408>>},<<24>>/<<1>>,{<<1>>},<<1>>,la]. An option must be a rule or a list of rules. >>

When I write analitical solution for my function:

b = 2*6.62607004*10^(-34)*299792458^2*Pi;
d = (6.62607004*10^(-34)*299792458)/(1.38064852*10^(-23));
Plankulis1[la_] := (1/G)*(b/(la^5*(Exp[d/(la*Te)] - 1)));
Te = 1500;
G = 1*10^(9);
Plankulis[G, b, la, d, Te]
Plot[Plankulis1[la], {la, 400*10^(-9), 
  700*10^(-8)}, {PlotRange -> Full},  Frame -> True]

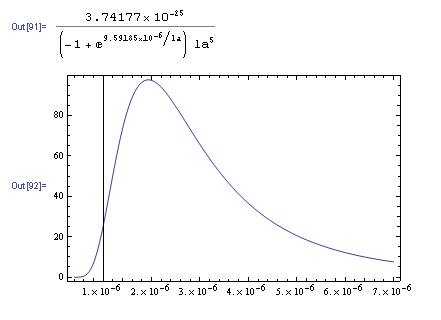
I get: enter image description here

I get out what I need.
What is it I am doing wrong? I did not really understood it in answers. Thank you.

$\endgroup$
9
  • 2
    $\begingroup$ What are the units of your data supposed to be? $\endgroup$ Commented Nov 9, 2017 at 14:36
  • 1
    $\begingroup$ Are you sure that you data follows the BlackBody radiation emission? $\endgroup$ Commented Nov 9, 2017 at 15:15
  • $\begingroup$ If you're certain that your fitting function is correct, try giving initial guesses for the free parameters you're fitting. If the correct values are very large or very small, FindFit might get stuck in some local optimum. I suspect that your value for A might need a nudge in the right direction. You can also try to fit the logarithm of your parameters (e.g., replace A -> Exp[logA] in the formula), since that makes it easier for the fitting algorithm to cover a large range of magnitudes. $\endgroup$ Commented Nov 9, 2017 at 16:55
  • 1
    $\begingroup$ @Jim, yes, that just amounts to finding the first and second radiation constants from the data for a given temperature. $\endgroup$ Commented Nov 9, 2017 at 18:34
  • 2
    $\begingroup$ It looks like you used FindFit[] wrong: try FindFit[dati, Plankulis[la, Te, G, b, d], {{G, 1*10^9}, {Te, 1500}}, la]. $\endgroup$ Commented Nov 11, 2017 at 16:33

2 Answers 2

4
$\begingroup$

Correction: What a difference good starting values can make. What I presented earlier totally missed values of the parameters that allow for a good fit.

Using a simpler parameterization with A -> 2 a c^2 h and T -> (c h t)/kb we have the equation

1/(a (-1 + E^(1/(l t))) l^5)

$$\frac{1}{a l^5 \left(e^{\frac{1}{l t}}-1\right)}$$

Using FindFit with good starting values (suggested by @SimonWoods) we have the following:

sol = FindFit[dati, 1/(a (-1 + E^(1/(l t))) l^5), {{a, 1/(6 10^24)}, {t, 0.00007}}, l]
(* {a -> 5.707889613047356`*^-24,t -> 0.00007085381301746858`} *)
Show[Plot[1/(a (-1 + E^(1/(l t))) l^5) /. sol, {l, 400, 900}, 
  PlotStyle -> {Thickness[0.02], Red}, PlotRange -> All], 
 ListPlot[dati, PlotStyle -> White]]

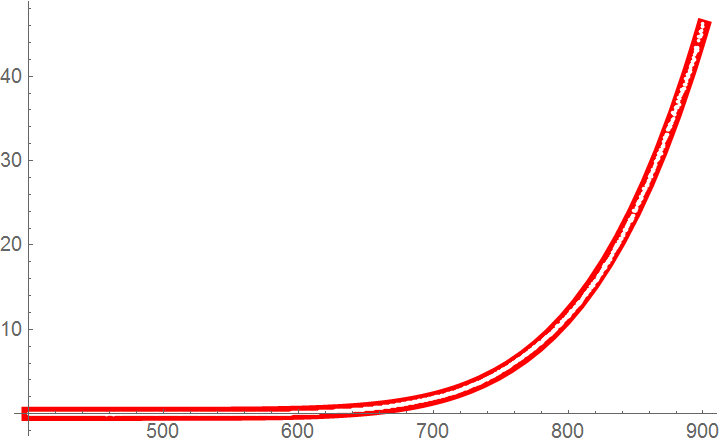
Data and fit

$\endgroup$
4
  • 1
    $\begingroup$ I disagree - what about t = 0.0001 for example $\endgroup$ Commented Nov 9, 2017 at 18:46
  • $\begingroup$ @SimonWoods You are correct. I didn't try enough values of t. I'll work on correcting my answer. $\endgroup$
    – JimB
    Commented Nov 9, 2017 at 18:49
  • $\begingroup$ @JimB I am curious about how t can be thought as negative if it is defined by means of positive quantities... $\endgroup$ Commented Nov 9, 2017 at 20:15
  • $\begingroup$ @JoséAntonioDíazNavas I wasn't advocating a negative value for t or implying a physical meaning for it. I was just trying different values of t and saw (for the limited range of values I tried) that there just seemed to be two shapes of curves. Fortunately Simon Woods pointed out my error. $\endgroup$
    – JimB
    Commented Nov 9, 2017 at 20:42
1
$\begingroup$

No need what JimB did. Just correct the units for $\lambda$, i.e., not nanometers but meters. There was also some errors in the syntax when using FindFit. I also add ptsas a new dataset with less points suitable for plotting and compare to the fits.

Here is your code corrected:

dati = Import["https://pastebin.com/raw/MGEzkeC3", "Table"];
pts = dati[[#]] & /@ Table[i, {i, 1, 1458, 50}];
h = 6.62607004*10^(-34);
c = 299792458;
kb = 1.38064852*10^(-23);
Planks[l_, T_, A_] := (2*h*c^2 10^45)/(A l^5 (Exp[(10^9 h*c)/(l*kb*T)] - 1));
fittesana2 = FindFit[dati, Planks[l, T, A], {{A, 1*10^8}, {T, 1700}}, l];
Plot[Planks[l, T, A] /. fittesana2, {l, 400, 900}, PlotStyle -> Red, 
PlotRange -> All, Epilog :> {Blue, PointSize[0.015], Point[pts]}]
Pfit = NonlinearModelFit[dati, 
Planks[l, T, A], {{A, 1*10^8}, {T, 1700}}, l]
Plot[Pfit[l], {l, 400, 900}, PlotStyle -> Red, PlotRange -> All, 
Epilog :> {Blue, PointSize[0.015], Point[pts]}]
Normal[Pfit]
Pfit["ANOVATable"]
Pfit["ParameterTable"]
Pfit["FitCurvatureTable"]

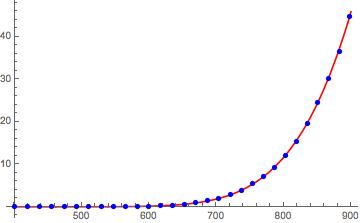
The results with FindFit:

enter image description here

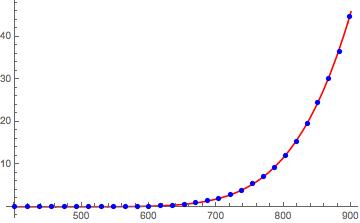
and with NonLinearModel Fit:

enter image description here

Adicional data:

enter image description here

enter image description here

enter image description here

enter image description here

$\endgroup$

Your Answer

By clicking “Post Your Answer”, you agree to our terms of service and acknowledge you have read our privacy policy.

Not the answer you're looking for? Browse other questions tagged or ask your own question.